
This is part four of a four-part blog series. In this final installment, I’ll explain the second of two scenarios available for Calico and Kubernetes deployment, in which Calico is configured to peer with Border Gateway Protocol (BGP) with IP Fabric and it doesn’t encapsulate inter-pod traffic into VXLAN. If you are interested in Calico deployment with VXLAN encapsulation, please see the previous blog post.
You can read about data centre networking in Part 1, and how to bring up your own data centre network in Part 2.
I hope this series will prove helpful when you are involved in the third stage of a Cloud Native transformation, known as Build, when you are helping create the systems to help your organisation compete and grow.
All scripts and playbooks used in this blog post can be found in this GitLab repository, in case you want to bring the whole environment up on your own workstation.
If you followed along this series, at this point you should have a Kubernetes cluster operational but all nodes stuck in NotReady state. This is due to the lack of a networking component that we are about to deploy.
Kubernetes Inter-Workload Communication Without an Overlay Network
In this scenario, Calico networking components do not use any form of traffic encapsulation. This implies that the network must be aware of IP addressing used within the Kubernetes cluster.
Similar to the previous scenario we explored in this series, we have an IP Fabric architecture running eBGP between the spine and leaf switches, but in this case the BGP peering is extended to the Kubernetes cluster with iBGP. Each Kubernetes cluster node will peer with a directly connected leaf switch with iBGP. This is required to exchange routing information between the IP Fabric and Kubernetes cluster nodes. Here’s what Kubernetes networking with BGP peering, a control plane, and a data plane looks like:
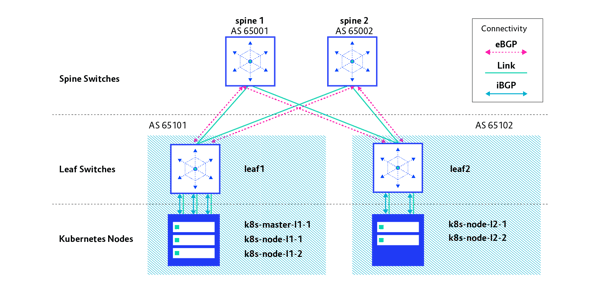
Each leaf switch has a unique AS number assigned to and it is shared across all nodes directly connected to that specific switch. In this setup, we need to run a BGP route reflector on each leaf switch. This will reflect all routes advertised by nodes to each other within the same AS.
In this scenario, 10.64.0.0/12 and 10.80.0.0/12 prefixes will be used for pods and services, respectively.
The network deployment using BGP peering with IP Fabric network requires, besides basic Calico manifest files, manifest files that contain BGPPeer, and node-specific configuration for the Kubernetes nodes. All manifest files used in this scenario can be fetched from the GitLab repository.
To enable Calico to support this scenario, some requirements must be addressed:
- Calico must use bird as calico_backend in the calico.yaml file, as this will enable BGP functionality in Calico through BIRD, which is an IP routing daemon.
- The BGP peering configuration must be provided to Calico in order to tell Kubernetes nodes which leaf switches to peer with.
- Node configuration must be provided in order to tell Kubernetes nodes what IP and AS number to use when peering with leaf switches.
The BGPPeer and Node manifests leverage node tagging to push the correct config to specific nodes. For instance, nodes connected to leaf1 are labeled with asnum label set to 65101. Similarly, nodes connected to leaf2 are labeled with asnum set to 65102.
When all nodes have the labels set, BGPPeer manifest must be applied to the Kubernetes cluster. Sample config for all nodes that should peer with leaf1 can be found below. BGPPeer can use nodeSelector to pick nodes and tell BIRD daemon what IP and AS it should peer with.
apiVersion: projectcalico.org/v3
kind: BGPPeer
metadata:
name: as65101-k8s-nodes-to-leaf1
spec:
peerIP: 10.0.101.1
asNumber: 65101
nodeSelector: "asnum == '65101'"
The node configuration file contains information about what AS number a specific node should use and what IP address to use for iBGP peering. A snippet from the node configuration file is listed below. This applies to k8s-node-l1-2:
apiVersion: projectcalico.org/v3
kind: Node
metadata:
name: k8s-node-l1-2
spec:
bgp:
asNumber: 65101
ipv4Address: 10.0.101.102/24
A snippet from the node configuration file is listed below. This is specific for k8s-node-l1-2:
apiVersion: projectcalico.org/v3
kind: Node
metadata:
name: k8s-node-l1-2
spec:
bgp:
asNumber: 65101
ipv4Address: 10.0.101.102/24
These two files amongst others related to BGPPeer and Node are deployed with the script below together with basic Calico manifests:
$ sh vagrant.calico-with-peering.sh
node/k8s-master-l1-1 labeled
Connection to 127.0.0.1 closed.
node/k8s-node-l1-1 labeled
Connection to 127.0.0.1 closed.
node/k8s-node-l1-2 labeled
Connection to 127.0.0.1 closed.
node/k8s-node-l2-1 labeled
Connection to 127.0.0.1 closed.
node/k8s-node-l2-2 labeled
Connection to 127.0.0.1 closed.
serviceaccount/calicoctl created
pod/calicoctl created
clusterrole.rbac.authorization.k8s.io/calicoctl created
clusterrolebinding.rbac.authorization.k8s.io/calicoctl created
Connection to 127.0.0.1 closed.
configmap/calico-config created
customresourcedefinition.apiextensions.k8s.io/felixconfigurations.crd.projectcalico.org created
customresourcedefinition.apiextensions.k8s.io/ipamblocks.crd.projectcalico.org created
customresourcedefinition.apiextensions.k8s.io/blockaffinities.crd.projectcalico.org created
customresourcedefinition.apiextensions.k8s.io/ipamhandles.crd.projectcalico.org created
customresourcedefinition.apiextensions.k8s.io/ipamconfigs.crd.projectcalico.org created
customresourcedefinition.apiextensions.k8s.io/bgppeers.crd.projectcalico.org created
customresourcedefinition.apiextensions.k8s.io/bgpconfigurations.crd.projectcalico.org created
customresourcedefinition.apiextensions.k8s.io/ippools.crd.projectcalico.org created
customresourcedefinition.apiextensions.k8s.io/hostendpoints.crd.projectcalico.org created
customresourcedefinition.apiextensions.k8s.io/clusterinformations.crd.projectcalico.org created
customresourcedefinition.apiextensions.k8s.io/globalnetworkpolicies.crd.projectcalico.org created
customresourcedefinition.apiextensions.k8s.io/globalnetworksets.crd.projectcalico.org created
customresourcedefinition.apiextensions.k8s.io/networkpolicies.crd.projectcalico.org created
customresourcedefinition.apiextensions.k8s.io/networksets.crd.projectcalico.org created
clusterrole.rbac.authorization.k8s.io/calico-kube-controllers created
clusterrolebinding.rbac.authorization.k8s.io/calico-kube-controllers created
clusterrole.rbac.authorization.k8s.io/calico-node created
clusterrolebinding.rbac.authorization.k8s.io/calico-node created
daemonset.apps/calico-node created
serviceaccount/calico-node created
deployment.apps/calico-kube-controllers created
serviceaccount/calico-kube-controllers created
Connection to 127.0.0.1 closed.
Successfully applied 5 'Node' resource(s)
Connection to 127.0.0.1 closed.
Successfully applied 3 resource(s)
Connection to 127.0.0.1 closed.
BGP sessions should be formed between the IP Fabric leaf switches and their directly connected Kubernetes nodes. Use commands in the snippet below to verify if the required BGP peerings are present and established.
$ vagrant ssh leaf1 -c "sudo net show bgp sum"
show bgp ipv4 unicast summary
=============================
BGP router identifier 172.16.255.101, local AS number 65101 vrf-id 0
BGP table version 10
RIB entries 15, using 2280 bytes of memory
Peers 5, using 96 KiB of memory
Peer groups 1, using 64 bytes of memory
Neighbor V AS MsgRcvd MsgSent TblVer InQ OutQ Up/Down State/PfxRcd
*10.0.101.10 4 65101 40 45 0 0 0 00:01:50 2
*10.0.101.101 4 65101 40 45 0 0 0 00:01:50 1
*10.0.101.102 4 65101 40 45 0 0 0 00:01:50 1
spine-sw1.lab.local(172.16.0.0) 4 65001 753 755 0 0 0 00:37:14 4
spine-sw2.lab.local(172.16.0.4) 4 65002 753 755 0 0 0 00:37:14 4
$ vagrant ssh leaf2 -c "sudo net show bgp sum"
show bgp ipv4 unicast summary
=============================
BGP router identifier 172.16.255.102, local AS number 65102 vrf-id 0
BGP table version 9
RIB entries 15, using 2280 bytes of memory
Peers 4, using 77 KiB of memory
Peer groups 1, using 64 bytes of memory
Neighbor V AS MsgRcvd MsgSent TblVer InQ OutQ Up/Down State/PfxRcd
*10.0.102.101 4 65102 43 49 0 0 0 00:02:00 1
*10.0.102.102 4 65102 43 49 0 0 0 00:01:59 1
spine-sw1.lab.local(172.16.0.2) 4 65001 756 758 0 0 0 00:37:23 5
spine-sw2.lab.local(172.16.0.6) 4 65002 756 758 0 0 0 00:37:23 5
Note that each configured BGP Neighbor has successfully established peering and BGP messages are being exchanged (MsgRcvd/MsgSent columns), which can be observed in the outputs above.
We can now move to testing the cluster in a similar manner as we did in the previous post. Login to the Kubernetes master node (k8s-master-l1-1) to inspect the state of the Kubernetes nodes with kubectl command. All nodes should move to the Ready state now, as the networking component was deployed. It is also good to check whether all required Calico pods were deployed successfully on all nodes. It should look like this:
$ vagrant ssh k8s-master-l1-1
[vagrant@k8s-master-l1-1 ~]$ kubectl get nodes
NAME STATUS ROLES AGE VERSION
k8s-master-l1-1 Ready master 17m v1.15.3
k8s-node-l1-1 Ready <none> 16m v1.15.3
k8s-node-l1-2 Ready <none> 16m v1.15.3
k8s-node-l2-1 Ready <none> 16m v1.15.3
k8s-node-l2-2 Ready <none> 16m v1.15.3
[vagrant@k8s-master-l1-1 ~]$ kubectl get pods -n kube-system
NAME READY STATUS RESTARTS AGE
calico-kube-controllers-59f54d6bbc-wlmwb 1/1 Running 0 15m
calico-node-8zj5k 1/1 Running 0 15m
calico-node-br862 1/1 Running 0 15m
calico-node-lsh6c 1/1 Running 0 15m
calico-node-n64l2 1/1 Running 0 15m
calico-node-r2csj 1/1 Running 0 15m
calicoctl 1/1 Running 0 15m
coredns-5c98db65d4-bcjtq 1/1 Running 0 17m
coredns-5c98db65d4-zgpv8 1/1 Running 0 17m
etcd-k8s-master-l1-1 1/1 Running 0 16m
kube-apiserver-k8s-master-l1-1 1/1 Running 0 16m
kube-controller-manager-k8s-master-l1-1 1/1 Running 0 16m
kube-proxy-fsrcv 1/1 Running 0 16m
kube-proxy-j2xd7 1/1 Running 0 16m
kube-proxy-jsxlb 1/1 Running 0 16m
kube-proxy-kp2j6 1/1 Running 0 17m
kube-proxy-tdlxs 1/1 Running 0 16m
kube-scheduler-k8s-master-l1-1 1/1 Running 0 16m
If all nodes are in the Ready state and calico pods are in the Running state, it means the control plane of Calico is up and operational. In order to inspect the data plane, a sample deployment with a service in a dedicated namespace can be deployed to the cluster. A simple Nginx deployment can be found and applied from the demo folder, as below. A single pod with Nginx will deployed to the cluster in namespace space1.
[vagrant@k8s-master-l1-1 ~]$ kubectl apply -f demo/namespace.yaml
namespace/space1 created
[vagrant@k8s-master-l1-1 ~]$ kubectl apply -f demo/deployment.yaml
deployment.extensions/nginx-deployment created
[vagrant@k8s-master-l1-1 ~]$ kubectl apply -f demo/service.yaml
service/nginx-service created
[vagrant@k8s-master-l1-1 ~]$ kubectl get pods -n space1
NAME READY STATUS RESTARTS AGE
nginx-deployment-55457b9d87-rldn7 1/1 Running 0 54s
The Nginx deployment must be scaled to four pods in order to deploy pods on other nodes, so that the inter-pod IP reachability can be tested.
[vagrant@k8s-master-l1-1 ~]$ kubectl scale deployment/nginx-deployment --replicas=4 -n space1
deployment.extensions/nginx-deployment scaled
According to the outlet seen here, four pods were deployed on four distinct nodes:
[vagrant@k8s-master-l1-1 ~]$ kubectl get pods -n space1 -o wide
NAME READY STATUS RESTARTS AGE IP NODE NOMINATED NODE READINESS GATES
nginx-deployment-55457b9d87-655sm 1/1 Running 0 28s 10.65.76.192 k8s-node-l1-2 <none> <none>
nginx-deployment-55457b9d87-ghfxl 1/1 Running 0 28s 10.76.172.128 k8s-node-l2-2 <none> <none>
nginx-deployment-55457b9d87-jzcbh 1/1 Running 0 28s 10.68.86.128 k8s-node-l2-1 <none> <none>
nginx-deployment-55457b9d87-rldn7 1/1 Running 0 96s 10.67.209.0 k8s-node-l1-1 <none> <none>
In a separate terminal, verify if pod routes are propagated from Kubernetes nodes to IP Fabric leaf switches and then through the IP Fabric. Use the commands from the code snippets below (some of the output is omitted for brevity):
$ vagrant ssh leaf1 -c "sudo net show bgp"
*>i10.64.213.128/26 10.0.101.10 100 0 i
*>i10.65.76.192/26 10.0.101.102 100 0 i
*>i10.67.209.0/26 10.0.101.101 100 0 i
* 10.68.86.128/26 172.16.0.4 0 65002 65102 i
*> 172.16.0.0 0 65001 65102 i
* 10.76.172.128/26 172.16.0.4 0 65002 65102 i
*> 172.16.0.0 0 65001 65102 i
$ vagrant ssh leaf2 -c "sudo net show bgp "
*> 10.64.213.128/26 172.16.0.2 0 65001 65101 i
* 172.16.0.6 0 65002 65101 i
* 10.65.76.192/26 172.16.0.6 0 65002 65101 i
*> 172.16.0.2 0 65001 65101 i
* 10.67.209.0/26 172.16.0.6 0 65002 65101 i
*> 172.16.0.2 0 65001 65101 i
*>i10.68.86.128/26 10.0.102.101 100 0 i
*>i10.76.172.128/26 10.0.102.102 100 0 i
As it can be observed in the snippets, each node is advertising its route with a /26 prefix, which is part of the 10.64.0.0/12 CIDR block. This block was defined in the Calico configuration file. Then these routes are being propagated across the IP Fabric and appear on remote leaf switches with AS_PATH populated with AS numbers of leaf and spine switches.
Now we return to the previous console, running a SSH session to k8s-master-l1-1 and login to the container running on k8s-node-l2-1. Next, we install a ping utility. Then we issue ping towards the Nginx container running on k8s-node-l1-2 (10.65.76.192), which is connected to leaf1 switch. Here’s what it looks like (output is omitted for brevity):
[vagrant@k8s-master-l1-1 ~]$ kubectl exec -it nginx-deployment-55457b9d87-jzcbh -n space1 -- bash
root@nginx-deployment-55457b9d87-jzcbh:/# apt update && apt install iputils-ping
root@nginx-deployment-55457b9d87-jzcbh:/# ping 10.65.76.192
PING 10.65.76.192 (10.65.76.192) 56(84) bytes of data.
64 bytes from 10.65.76.192: icmp_seq=1 ttl=59 time=1.06 ms
64 bytes from 10.65.76.192: icmp_seq=2 ttl=59 time=1.20 ms
64 bytes from 10.65.76.192: icmp_seq=3 ttl=59 time=1.15 ms
Open a new tab in your terminal and SSH into k8s-node-l2-1. In order to inspect the traffic, a tcpdump utility will be used. First, it needs to be installed on the node. Since there is no encapsulation, pure ICMP traffic will be captured. Traffic capture needs to be taken on interface eth0, which is a connection to IP Fabric network. Here’s how you do that (output omitted for brevity):
$ vagrant ssh k8s-node-l2-1
[vagrant@k8s-node-l2-1 ~]$ sudo yum install -y tcpdump

[vagrant@k8s-node-l2-1 ~]$ sudo tcpdump -i eth0 -ne icm
tcpdump: verbose output suppressed, use -v or -vv for full protocol decode
listening on eth0, link-type EN10MB (Ethernet), capture size 262144 bytes
13:06:23.248977 08:00:27:33:fa:f7 > 08:00:27:74:be:4a, ethertype IPv4 (0x0800), length 98: 10.68.86.128 > 10.65.76.192: ICMP echo request, id 336, seq 1, length 64
13:06:23.249970 08:00:27:74:be:4a > 08:00:27:33:fa:f7, ethertype IPv4 (0x0800), length 98: 10.65.76.192 > 10.68.86.128: ICMP echo reply, id 336, seq 1, length 64
13:06:24.250824 08:00:27:33:fa:f7 > 08:00:27:74:be:4a, ethertype IPv4 (0x0800), length 98: 10.68.86.128 > 10.65.76.192: ICMP echo request, id 336, seq 2, length 64
13:06:24.251957 08:00:27:74:be:4a > 08:00:27:33:fa:f7, ethertype IPv4 (0x0800), length 98: 10.65.76.192 > 10.68.86.128: ICMP echo reply, id 336, seq 2, length 64
13:06:25.253033 08:00:27:33:fa:f7 > 08:00:27:74:be:4a, ethertype IPv4 (0x0800), length 98: 10.68.86.128 > 10.65.76.192: ICMP echo request, id 336, seq 3, length 64
13:06:25.254121 08:00:27:74:be:4a > 08:00:27:33:fa:f7, ethertype IPv4 (0x0800), length 98: 10.65.76.192 > 10.68.86.128: ICMP echo reply, id 336, seq 3, length 64
The packet capture observed few ethernet frames exchanged between the pod running on k8s-node-l2-1 and the pod running on k8s-node-l1-2. It contains the payload with ICMP echo request and ICMP echo reply exchanged between a pod with an IP of 10.68.86.128 and pod with an IP of 10.65.76.192. There is no additional encapsulation involved in this scenario, so the packet sent by the pod is the packet on the wire.
A successful response to the ping command confirms that IP reachability was achieved, with BGP peering between pods running on two distinct nodes without any additional encapsulation.
Thank you for following along, and I hope it’s helpful. If you missed any parts of the series and want to backtrack, here’s where you can find parts one, two, and three.
We have our first-ever book coming: 'Cloud Native Transformation: Practical Patterns for Innovation'. Click below to pre-order now!