
The previous post in this series took a deep dive into setting up IP Fabric on Cumulus VX and spinning up a Kubernetes cluster connected to it. This post focuses on one of the scenarios available for Calico and Kubernetes deployment. (Our next post looks at a second scenario; the start of this series walked you through a history of data centre networking and Calico for Kubernetes.)
If you followed along with the previous post, you now need to deploy the Calico networking plugin to get the cluster operational. This post describes Calico deployment with an VXLAN overlay network. If you are interested in deployment using BGP and without encapsulation, see the next post in this series.
I hope this series will prove helpful when you are involved in the third stage of a Cloud Native transformation, known as Build, when you are helping create the systems to help your organisation compete and grow.
All scripts and playbooks used in this blog post can be found in this GitLab repository, in case you wanted to bring the whole environment up on your own workstation.
Kubernetes Inter-Workload Communication with an Overlay Network
In this scenario, Calico networking components encapsulate inter-workload traffic into VXLAN. This gives tool to move traffic across the network without making it aware of workload or service IP addresses. It is not required to run BGP networking on Kubernetes nodes, so it can be disabled to remove an additional layer of complexity.
As presented on the diagram below, the IP routing protocol (eBGP) runs independently from Kubernetes networking and does not interact with Kubernetes IP routing. The eBGP protocol is responsible for advertising IP addresses of the directly connected networks to leaf1 and leaf2 switches respectively. This is to achieve node-to-node IP reachability across the IP Fabric, which is required by Calico to build a VXLAN overlay network for Kubernetes.
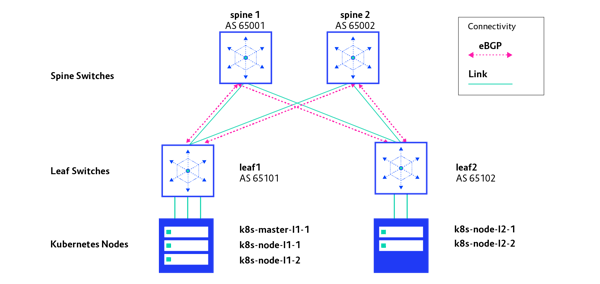
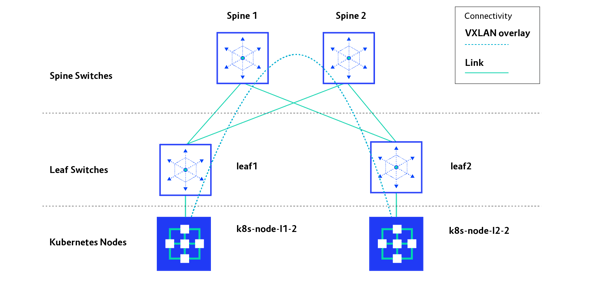
Since IP Fabric provides only node-to-node reachability, it is not aware of IP addressing used for Kubernetes workloads. Therefore, any inter-workload traffic must be encapsulated into VXLAN in this case. As presented on the diagram below, for any inter-pod traffic, a dynamic overlay tunnel between two nodes is built to carry workload traffic.
To support this scenario, we need to set VXLAN as the calico_backend in the calico.yaml file. Note that this will disable BGP functionality in Calico, which is not required for this scenario to work.
The complete calico.yaml file can be found in the GitLab repository. It is worth mentioning that this file also tells Calico what CIDRs should be used for pod and service addressing on Kubernetes nodes. Inspect CALICO_IPV4POOL_CIDR and CALICO_ADVERTISE_CLUSTER_IPS variables in that file. In this scenario, 10.64.0.0/12 and 10.80.0.0/12 prefixes will be used for pods and services, respectively.
Execute the vagrant.calico-vxlan-overlay.sh script to deploy networking for this scenario:
$ sh vagrant.calico-vxlan-overlay.sh
serviceaccount/calicoctl created
pod/calicoctl created
clusterrole.rbac.authorization.k8s.io/calicoctl created
clusterrolebinding.rbac.authorization.k8s.io/calicoctl created
Connection to 127.0.0.1 closed.
configmap/calico-config created
customresourcedefinition.apiextensions.k8s.io/felixconfigurations.crd.projectcalico.org created
customresourcedefinition.apiextensions.k8s.io/ipamblocks.crd.projectcalico.org created
customresourcedefinition.apiextensions.k8s.io/blockaffinities.crd.projectcalico.org created
customresourcedefinition.apiextensions.k8s.io/ipamhandles.crd.projectcalico.org created
customresourcedefinition.apiextensions.k8s.io/ipamconfigs.crd.projectcalico.org created
customresourcedefinition.apiextensions.k8s.io/bgppeers.crd.projectcalico.org created
customresourcedefinition.apiextensions.k8s.io/bgpconfigurations.crd.projectcalico.org created
customresourcedefinition.apiextensions.k8s.io/ippools.crd.projectcalico.org created
customresourcedefinition.apiextensions.k8s.io/hostendpoints.crd.projectcalico.org created
customresourcedefinition.apiextensions.k8s.io/clusterinformations.crd.projectcalico.org created
customresourcedefinition.apiextensions.k8s.io/globalnetworkpolicies.crd.projectcalico.org created
customresourcedefinition.apiextensions.k8s.io/globalnetworksets.crd.projectcalico.org created
customresourcedefinition.apiextensions.k8s.io/networkpolicies.crd.projectcalico.org created
customresourcedefinition.apiextensions.k8s.io/networksets.crd.projectcalico.org created
clusterrole.rbac.authorization.k8s.io/calico-kube-controllers created
clusterrolebinding.rbac.authorization.k8s.io/calico-kube-controllers created
clusterrole.rbac.authorization.k8s.io/calico-node created
clusterrolebinding.rbac.authorization.k8s.io/calico-node created
daemonset.apps/calico-node created
serviceaccount/calico-node created
deployment.apps/calico-kube-controllers created
serviceaccount/calico-kube-controllers created
To verify that BGP sessions are established between IP Fabric switches and there are no other sessions, use the commands in the snippet below:
$ vagrant ssh leaf1 -c "sudo net show bgp sum"
show bgp ipv4 unicast summary
=============================
BGP router identifier 172.16.255.101, local AS number 65101 vrf-id 0
BGP table version 6
RIB entries 11, using 1672 bytes of memory
Peers 2, using 39 KiB of memory
Peer groups 1, using 64 bytes of memory
Neighbor V AS MsgRcvd MsgSent TblVer InQ OutQ Up/Down State/PfxRcd
spine-sw1.lab.local(172.16.0.0) 4 65001 2564 2566 0 0 0 02:07:56 3
spine-sw2.lab.local(172.16.0.4) 4 65002 2565 2566 0 0 0 02:07:56 3
Total number of neighbors 2
$ vagrant ssh leaf2 -c "sudo net show bgp sum"
show bgp ipv4 unicast summary
=============================
BGP router identifier 172.16.255.102, local AS number 65102 vrf-id 0
BGP table version 6
RIB entries 11, using 1672 bytes of memory
Peers 2, using 39 KiB of memory
Peer groups 1, using 64 bytes of memory
Neighbor V AS MsgRcvd MsgSent TblVer InQ OutQ Up/Down State/PfxRcd
spine-sw1.lab.local(172.16.0.2) 4 65001 2560 2562 0 0 0 02:07:43 4
spine-sw2.lab.local(172.16.0.6) 4 65002 2561 2562 0 0 0 02:07:43 4
Total number of neighbors 2
In the output above you can observe that each of two leaf switches has two BGP sessions to both spines. No other sessions are established.
Next, login to the Kubernetes master node (k8s-master-l1-1) and inspect the state of Kubernetes nodes with a kubectl get nodes -o widel command. All nodes should have moved to the Ready state now, as the networking component was deployed. We should also check whether all required Calico pods were deployed successfully on all nodes:
$ vagrant ssh k8s-master-l1-1
[vagrant@k8s-master-l1-1 ~]$ kubectl get nodes
NAME STATUS ROLES AGE VERSION
k8s-master-l1-1 Ready master 20h v1.15.2
k8s-node-l1-1 Ready <none> 20h v1.15.2
k8s-node-l1-2 Ready <none> 20h v1.15.2
k8s-node-l2-1 Ready <none> 20h v1.15.2
k8s-node-l2-2 Ready <none> 20h v1.15.2
[vagrant@k8s-master-l1-1 ~]$ kubectl get pods -n kube-system
NAME READY STATUS RESTARTS AGE
calico-kube-controllers-59f54d6bbc-xpn6z 1/1 Running 0 24m
calico-node-8wdhx 1/1 Running 0 24m
calico-node-hwkkx 1/1 Running 0 24m
calico-node-mm4lw 1/1 Running 0 24m
calico-node-qwzml 1/1 Running 0 24m
calico-node-txjvc 1/1 Running 0 24m
calicoctl 1/1 Running 0 24m
coredns-5c98db65d4-27f97 1/1 Running 0 20h
coredns-5c98db65d4-hbzts 1/1 Running 0 20h
etcd-k8s-master-l1-1 1/1 Running 1 20h
kube-apiserver-k8s-master-l1-1 1/1 Running 1 20h
kube-controller-manager-k8s-master-l1-1 1/1 Running 1 20h
kube-proxy-49db5 1/1 Running 1 20h
kube-proxy-nczf7 1/1 Running 1 20h
kube-proxy-tw7sm 1/1 Running 1 20h
kube-proxy-x76j7 1/1 Running 1 20h
kube-proxy-zdvql 1/1 Running 1 20h
kube-scheduler-k8s-master-l1-1 1/1 Running 1 20h
If all nodes are in the Ready state and Calico pods are in the Running state, it means the control plane of Calico is up and operational. In order to inspect the data plane with VXLAN encapsulation, a sample deployment with a service can be deployed to the cluster. A simple Nginx deployment can be found in the demo folder and applied as shown:
[vagrant@k8s-master-l1-1 ~]$ kubectl apply -f demo/namespace.yaml
namespace/space1 created
[vagrant@k8s-master-l1-1 ~]$ kubectl apply -f demo/deployment.yaml
deployment.extensions/nginx-deployment created
[vagrant@k8s-master-l1-1 ~]$ kubectl apply -f demo/service.yaml
service/nginx-service created
[vagrant@k8s-master-l1-1 ~]$ kubectl get pods -n space1 -o wide
NAME READY STATUS RESTARTS AGE IP NODE NOMINATED NODE READINESS GATES
nginx-deployment-55457b9d87-nnzz5 1/1 Running 0 56s 10.65.76.193 k8s-node-l1-2 <none> <none>
The Nginx deployment must be scaled to four pods in order to deploy pods on other nodes, so inter-pod IP reachability can be tested. We can achieve this with the scale command:
[vagrant@k8s-master-l1-1 ~]$ kubectl scale deployment/nginx-deployment --replicas=4 -n space1
deployment.extensions/nginx-deployment scaled
Per the output shown here, four pods were deployed on four distinct nodes:
[vagrant@k8s-master-l1-1 ~]$ kubectl get pods -n space1 -o wide
NAME READY STATUS RESTARTS AGE IP NODE NOMINATED NODE READINESS GATES
nginx-deployment-55457b9d87-nnzz5 1/1 Running 0 4m3s 10.65.76.193 k8s-node-l1-2 <none> <none>
nginx-deployment-55457b9d87-x9llj 1/1 Running 0 13s 10.67.209.2 k8s-node-l1-1 <none> <none>
nginx-deployment-55457b9d87-xhhwl 1/1 Running 0 13s 10.76.172.132 k8s-node-l2-2 <none> <none>
nginx-deployment-55457b9d87-z9pl9 1/1 Running 0 13s 10.68.86.129 k8s-node-l2-1 <none> <none>
Next we want to check that there is a path through the network between pods. We will test it with a simple ping utility.
Login to the nginx-deployment-55457b9d87-z9pl9 pod running on k8s-node-l2-1 with kubectl exec command and install the ping utility. Issue a ping towards the Nginx pod nginx-deployment-55457b9d87-nnzz5 running on k8s-node-l1-2 (10.65.76.193), which is connected to leaf1 switch. (Output is omitted below, for brevity.)
[vagrant@k8s-master-l1-1 ~]$ kubectl exec -it nginx-deployment-55457b9d87-z9pl9 -n space1 -- bash
root@nginx-deployment-55457b9d87-z9pl9:/# apt update && apt install iputils-ping
debconf: falling back to frontend: Teletype
Setting up iputils-ping (3:20180629-2) ...
Processing triggers for libc-bin (2.28-10) ...
root@nginx-deployment-55457b9d87-z9pl9:/# ping 10.65.76.193
PING 10.65.76.193 (10.65.76.193) 56(84) bytes of data.
64 bytes from 10.65.76.193: icmp_seq=1 ttl=62 time=1.57 ms
64 bytes from 10.65.76.193: icmp_seq=2 ttl=62 time=1.86 ms
64 bytes from 10.65.76.193: icmp_seq=3 ttl=62 time=1.60 ms
64 bytes from 10.65.76.193: icmp_seq=4 ttl=62 time=1.56 ms
As you can see in the output above, the remote pod successfully responded to ping requests. So this means there is a path over the network between two pods running on distinct nodes.
Now we should inspect the traffic leaving one of the nodes, to verify whether traffic is encapsulated into VXLAN as planned. Open a new tab in your terminal and ssh into k8s-node-l2-1. In order to inspect the traffic, the tcpdump utility will be used. First it needs to be installed on the node. Since VXLAN encapsulation is using the UDP protocol on port 4789, it is enough to capture any UDP traffic on that port with tcpdump. Traffic capture needs to be done on interface eth0, which is connected to IP Fabric network. (Some output omitted for brevity.)
piotrszlenk@mbpro13 ~/Documents/Dev/calico-cumulus (master) $ vagrant ssh k8s-node-l2-1
[vagrant@k8s-node-l2-1 ~]$ sudo yum install -y tcpdump
[vagrant@k8s-node-l2-1 ~]$ sudo tcpdump -i eth0 -ne udp port 4789
tcpdump: verbose output suppressed, use -v or -vv for full protocol decode
listening on eth0, link-type EN10MB (Ethernet), capture size 262144 bytes
08:57:12.688881 08:00:27:53:73:c7 > 08:00:27:91:d4:66, ethertype IPv4 (0x0800), length 148: 10.0.102.101.41553 > 10.0.101.102.4789: VXLAN, flags [I] (0x08), vni 4096
66:92:0a:fb:a9:be > 66:81:2e:61:22:8a, ethertype IPv4 (0x0800), length 98: 10.68.86.129 > 10.65.76.193: ICMP echo request, id 592, seq 1, length 64
08:57:12.690316 08:00:27:91:d4:66 > 08:00:27:53:73:c7, ethertype IPv4 (0x0800), length 148: 10.0.101.102.32779 > 10.0.102.101.4789: VXLAN, flags [I] (0x08), vni 4096
66:81:2e:61:22:8a > 66:92:0a:fb:a9:be, ethertype IPv4 (0x0800), length 98: 10.65.76.193 > 10.68.86.129: ICMP echo reply, id 592, seq 1, length 64
08:57:13.690925 08:00:27:53:73:c7 > 08:00:27:91:d4:66, ethertype IPv4 (0x0800), length 148: 10.0.102.101.41553 > 10.0.101.102.4789: VXLAN, flags [I] (0x08), vni 4096
66:92:0a:fb:a9:be > 66:81:2e:61:22:8a, ethertype IPv4 (0x0800), length 98: 10.68.86.129 > 10.65.76.193: ICMP echo request, id 592, seq 2, length 64
>08:57:13.692672 08:00:27:91:d4:66 > 08:00:27:53:73:c7, ethertype IPv4 (0x0800), length 148: 10.0.101.102.32779 > 10.0.102.101.4789: VXLAN, flags [I] (0x08), vni 4096
66:81:2e:61:22:8a > 66:92:0a:fb:a9:be, ethertype IPv4 (0x0800), length 98: 10.65.76.193 > 10.68.86.129: ICMP echo reply, id 592, seq 2, length 64
08:57:14.691941 08:00:27:53:73:c7 > 08:00:27:91:d4:66, ethertype IPv4 (0x0800), length 148: 10.0.102.101.41553 > 10.0.101.102.4789: VXLAN, flags [I] (0x08), vni 4096
66:92:0a:fb:a9:be > 66:81:2e:61:22:8a, ethertype IPv4 (0x0800), length 98: 10.68.86.129 > 10.65.76.193: ICMP echo request, id 592, seq 3, length 64
08:57:14.693449 08:00:27:91:d4:66 > 08:00:27:53:73:c7, ethertype IPv4 (0x0800), length 148: 10.0.101.102.32779 > 10.0.102.101.4789: VXLAN, flags [I] (0x08), vni 4096
66:81:2e:61:22:8a > 66:92:0a:fb:a9:be, ethertype IPv4 (0x0800), length 98: 10.65.76.193 > 10.68.86.129: ICMP echo reply, id 592, seq 3, length 64
08:57:15.693151 08:00:27:53:73:c7 > 08:00:27:91:d4:66, ethertype IPv4 (0x0800), length 148: 10.0.102.101.41553 > 10.0.101.102.4789: VXLAN, flags [I] (0x08), vni 4096
66:92:0a:fb:a9:be > 66:81:2e:61:22:8a, ethertype IPv4 (0x0800), length 98: 10.68.86.129 > 10.65.76.193: ICMP echo request, id 592, seq 4, length 64
08:57:15.694624 08:00:27:91:d4:66 > 08:00:27:53:73:c7, ethertype IPv4 (0x0800), length 148: 10.0.101.102.32779 > 10.0.102.101.4789: VXLAN, flags [I] (0x08), vni 4096
66:81:2e:61:22:8a > 66:92:0a:fb:a9:be, ethertype IPv4 (0x0800), length 98: 10.65.76.193 > 10.68.86.129: ICMP echo reply, id 592, seq 4, length 64
As it can be observed in the packet capture, the ethernet frame from k8s-node-l2-1 (IP 10.0.102.101) to k8s-node-l1-2 (IP 10.0.101.102) contains an ICMP echo request packet originated from a container with the IP of 10.68.86.129 and targeted to a container with an IP of 10.65.76.193. That ICMP packet is encapsulated into VXLAN with VNI of 4096, which is a default value for Calico. Here’s what it looks like:
08:57:12.688881 08:00:27:53:73:c7 > 08:00:27:91:d4:66, ethertype IPv4 (0x0800), length 148: 10.0.102.101.41553 > 10.0.101.102.4789: VXLAN, flags [I] (0x08), vni 4096
66:92:0a:fb:a9:be > 66:81:2e:61:22:8a, ethertype IPv4 (0x0800), length 98: 10.68.86.129 > 10.65.76.193: ICMP echo request, id 592, seq 1, length 64
The next line shows the captured ethernet frame containing the ICMP echo reply message from a remote container encapsulated into VXLAN.
08:57:12.690316 08:00:27:91:d4:66 > 08:00:27:53:73:c7, ethertype IPv4 (0x0800), length 148: 10.0.101.102.32779 > 10.0.102.101.4789: VXLAN, flags [I] (0x08), vni 409666:81:2e:61:22:8a > 66:92:0a:fb:a9:be, ethertype IPv4 (0x0800), length 98: 10.65.76.193 > 10.68.86.129: ICMP echo reply, id 592, seq 1, length 64
A successful response to the ping command confirms that IP reachability was achieved as between pods running on two distinct nodes, as it can be observed in the output above. An overlay network with VXLAN encapsulation was used to move the traffic.
At this point the Kubernetes cluster should be fully operational with Calico as network component. The inter-Pod traffic is encapsulated in VXLAN thus underlying IP Fabric network is not aware of the IP addressing used for Pods or Services. No BGP peering was involved between the IP Fabric network and the Kubernetes nodes.
Now see another scenario available for Calico and Kubernetes deployment, in which Calico is configured to peer with BGP with IP Fabric, and doesn’t encapsulate inter-pod traffic into VXLAN.
We have our first-ever book coming: 'Cloud Native Transformation: Practical Patterns for Innovation'. Click below to pre-order now!