

Do you need to see results from your load tests? Do you know how to present stats on a well-arranged dashboard? We built an in-house solution called Locust Exporter for gathering metrics from load tests.
Let's just jump in!

In one of our projects, the customer asked us to design excellent CI/CD pipelines. Well, it’s hard to say how the best pipelines should look in general, because it totally depends on the application you are building. However, we were able to define stages by using best practices. One of those steps is a load test, which we execute via Locust.io.
Locust is an open source, Python-based tool to perform distributed load testing. This lightweight and scalable framework helps to figure out how many concurrent connections your application can handle.
Here’s how it works:
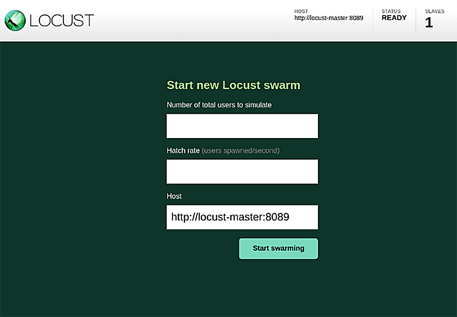
1. Execute load tests via Locust.io
First, we need an application with a written load test. We don’t want to reinvent the wheel. So, to help us explain, we will use a docker-compose example from github/locust.
Tip: In a real-world scenario, the optimal practice is to create one Locust Master with multiple workers, that are distributed all over the world. In that way, your generated traffic will be more real.
Use the following commands to start Locust Master with a predefined test. It will spin up with one active slave and it will be available under http://localhost:8089/.
git clone -b 0.14.5 git@github.com:locustio/locust.git
cd locust/examples/docker-compose
docker-compose up -d
2. Dump stats via Locust Exporter
Once you set up your Locust Master correctly with running tests, you are able to run Locust Exporter. This collector is really simple; it was written in Go and we tried to follow all Prometheus instructions on how to write exporters. So, it can be easily managed and extended. (At Container Solutions we love open source, so we publish open-source code widely in GitHub.)
In our example we will run Locust Exporter with default values, but you can specify your own settings by overwriting environmental variables.
docker run -d --net=host containersol/locust_exporter
Then, all the metrics will be available under http://localhost:9646/metrics. You will see something like this:
# HELP locust_running The current state of the execution (0 = STOPPED 1 = HATCHING 2 = RUNNING,).
# TYPE locust_running gauge
locust_running 2
# HELP locust_slave_detail The current status of a slave with user count
# TYPE locust_slave_detail gauge
locust_slave_detail{id="13cec536db7c_1b7f99cc88814224bfc4bd139e4c547c",state="running"} 123
# HELP locust_slaves_count The current number of slaves.
# TYPE locust_slaves_count gauge
locust_slaves_count 1
# HELP locust_slaves_hatching_count The current number of hatching slaves.
# TYPE locust_slaves_hatching_count gauge
locust_slaves_hatching_count 0
# HELP locust_slaves_missing_count The current number of missing slaves.
# TYPE locust_slaves_missing_count gauge
locust_slaves_missing_count 0
# HELP locust_slaves_running_count The current number of running slaves.
# TYPE locust_slaves_running_count gauge
locust_slaves_running_count 1
# HELP locust_up The current health status of the server (1 = UP, 0 = DOWN).
# TYPE locust_up gauge
locust_up 1
# HELP locust_users The current number of users.
# TYPE locust_users gauge
locust_users 123
3. Scrape metrics via Prometheus
The next step is to handle those metrics from Prometheus’s job. Prometheus is a monitoring system and time series database. We will not describe how to set it up, because Christiaan Vermeulen wrote an excellent article about how to set up Prometheus with Grafana. We will simply show you how to configure it to scrape metrics from Locust Exporter.
There is only one thing that you have to add in the /etc/prometheus/prometheus.yml file under the scrape_configs section.
 - job_name: "locust"
    scrape_interval: 2s
    static_configs:
      - targets: ["localhost:9646"]
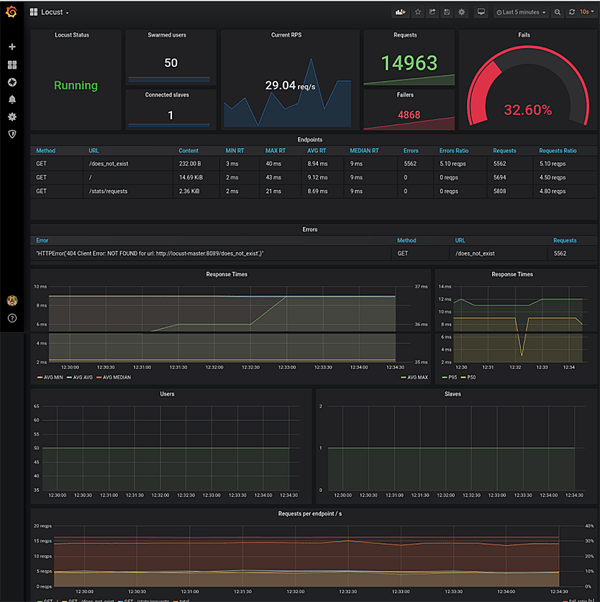
4. Display statistics on Grafana
Nowadays, one of the best ways to display metrics is with Grafana. We prepared the following dashboard and shared it publicly on grafana.com. You can import this board by ID 11985 or via the locust_dashboard.json file from the repository. In order to do that you can simply go to the Grafana dashboard home page, click on ‘Home’ then ‘Import dashboard’ link, and paste this ID into the ‘Grafana.com Dashboard’ field.
Summary
This is how you can use our exporter. From now on, after each load test you can see the results in your Grafana dashboard. It allows you to integrate into your monitoring system and gives you the ability to visualise the results of the load tests. You can also combine that solution with your pipelines, as we did. However, this has disadvantages and advantages; you have to choose what is more important for you. As a benefit, we received information how each new feature affects application performance, but it significantly lengthened the application deployment process.
Photo by Mats Speicher on Unsplash