

Monitoring a cluster is absolutely vital in a Cloud Native system. Prometheus and Grafana make it extremely easy to monitor just about any metric in your Kubernetes cluster.
In this blog post, I will show how to add monitoring for all the nodes in your cluster. (Here’s a Github repository with everything we cover here. Need a deeper dive ? Here is the long version.)

Before you get started, you’ll need: an existing Kubernetes Cluster, and kubectl & helm binaries locally installed.
Install Tiller (Helm Server) on Your Cluster
Installing Tiller is a bit more in-depth as you need to secure it in production clusters. For the purposes of keeping it simple and playing around, we will install it with normal cluster-admin roles.
If you need to secure it for a production cluster, here’s the documentation for Tiller.
Create the Tiller Service Account
Create a folder called helm. Here we will create all Kubernetes resources for tiller. Create a file called helm/service-account.yml and add the following content:
apiVersion: v1
kind: ServiceAccount
metadata:
name: tiller
namespace: kube-system
Then apply and test that the service account exists in the cluster.
$ kubectl apply -f helm/service-account.yml
$ kubectl get serviceaccounts -n kube-system
NAME SECRETS AGE
[...]
tiller 1 30h
Create the Service Account Role Binding
For demo purpose we will create a role binding to cluster-admin. But do not do this in production!
See here for more information
Create a file called helm/role-binding.yml in the helm folder with the content:
apiVersion: rbac.authorization.k8s.io/v1
kind: ClusterRoleBinding
metadata:
name: tiller
roleRef:
apiGroup: rbac.authorization.k8s.io
kind: ClusterRole
name: cluster-admin
subjects:
- kind: ServiceAccount
name: tiller
namespace: kube-system
Apply and test that the role binding exists on the cluster:
$ kubectl apply -f helm/role-binding.yml
$ kubectl get clusterrolebindings.rbac.authorization.k8s.io
NAME AGE
[...]>
tiller 30h
Deploy Tiller
$ helm init --service-account tiller --wait
The --wait flag makes sure that Tiller is finished before we apply the next few commands to start deploying Prometheus and Grafana.
Apply and test that Tiller is deployed and running:
$ kubectl get pods -n kube-system
NAME READY STATUS AGE
[...]
tiller-deploy-dbb85cb99-st8lt 1/1 Running 30h
Done! Tiller is deployed, and now the real fun starts.

Install Prometheus
We will separate our monitoring resources into a separate namespace to keep them together.
Create a folder called monitoring. Here we will create all our monitoring resources.
Create a file called monitoring/namespace.yml with the content:
kind: Namespace
apiVersion: v1
metadata:
name: monitoring
Apply and test that the namespace exists.
$ kubectl get namespaces
NAME STATUS AGE
[...]
monitoring Active 105m
Deploy Prometheus
Here is where the power of Helm steps in and makes life much easier.
First we need to update our local helm chart repo:
$ helm repo update
Next, deploy Prometheus into the monitoring namespace:
$ helm install stable/prometheus \
--namespace monitoring \
--name prometheus
This will deploy Prometheus into your cluster in the monitoring namespace and mark the release with the name prometheus.
Prometheus is now scraping the cluster together with the node-exporter and collecting metrics from the nodes.
We can confirm by checking that the pods are running:
$ kubectl get pods -n monitoring
NAME READY STATUS
prometheus-alertmanager-5c5958dcb7-bq2fw 2/2 Running
prometheus-kube-state-metrics-76d649cdf9-v5qg5 1/1 Running
prometheus-node-exporter-j74zq 1/1 Running
prometheus-node-exporter-x5xnq 1/1 Running
prometheus-pushgateway-6744d69d4-27dxb 1/1 Running
prometheus-server-669b987bcd-swcxh 2/2 Running
Install Grafana
When deploying Grafana, we need to configure it to read metrics from the right data sources.
Define the Grafana data sources.
Grafana takes data sources through yaml configs when it get provisioned. (For more information, see here.)
Kubernetes has nothing to do with importing the data. It merely orchestrates the injection of these yaml files.
When the Grafana Helm chart gets deployed, it will search for any config maps that contain a grafana_datasource label.
Create a Prometheus data source config map.
In the monitoring folder, create a sub-folder called grafana.
Here is where we will store our configs for the grafana deployment.
Create a file called monitoring/grafana/config.yml with the content:
apiVersion: v1
kind: ConfigMap
metadata:
name: prometheus-grafana-datasource
namespace: monitoring
labels:
grafana_datasource: '1'
data:
datasource.yaml: |-
apiVersion: 1
datasources:
- name: Prometheus
type: prometheus
access: proxy
orgId: 1
url: http://prometheus-server.monitoring.svc.cluster.local
Here is where we add the grafana_datasource label which will tell the Grafana provisioner that this is a datasource it should inject.
labels:
grafana_datasource: '1'
Apply and test the config:
$ kubectl apply -f monitoring/grafana/config.yml
$ kubectl get configmaps -n monitoring
NAME DATA AGE
[...]>
grafana 1 131m
Override Grafana value
When Grafana gets deployed and the provisioner runs, the data source provisioner is deactivated. We need to activate it so it searches for our config maps.
We need to create our own values.yml file to override the datasources search value, so when Grafana is deployed it will search our datasource.yml definition and inject it.
Create a file called monitoring/grafana/values.yml with the content:
sidecar:
datasources:
enabled: true
label: grafana_datasource
This will inject a sidecar which will load all the data sources into Grafana when it gets provisioned.
Now we can deploy Grafana with the overridden values.yml file and our datasource will be imported.
$ helm install stable/grafana \
-f monitoring/grafana/values.yml \
--namespace monitoring \
--name grafana
Check that it is running:
$ kubectl get pods -n monitoring
NAME READY STATUS RESTARTS AGE
[...]
grafana-5f4d8bcb94-ppsjq 1/1 Running
Get the Grafana Password
Grafana is deployed with a password. This is good news. But what’s the password ?
$ kubectl get secret \
--namespace monitoring grafana \
-o jsonpath="{.data.admin-password}" \
| base64 --decode ; echo
This will spit out the password to your Grafana dashboard.
The username is admin.
Port Forward the Grafana Dashboard to see what’s happening:
$ export POD_NAME=$(kubectl get pods --namespace monitoring -l "app=grafana,release=grafana" -o jsonpath="{.items[0].metadata.name}")
$ kubectl --namespace monitoring port-forward $POD_NAME 3000
Go to http://localhost:3000 in your browser. You should see the Grafana login screen:
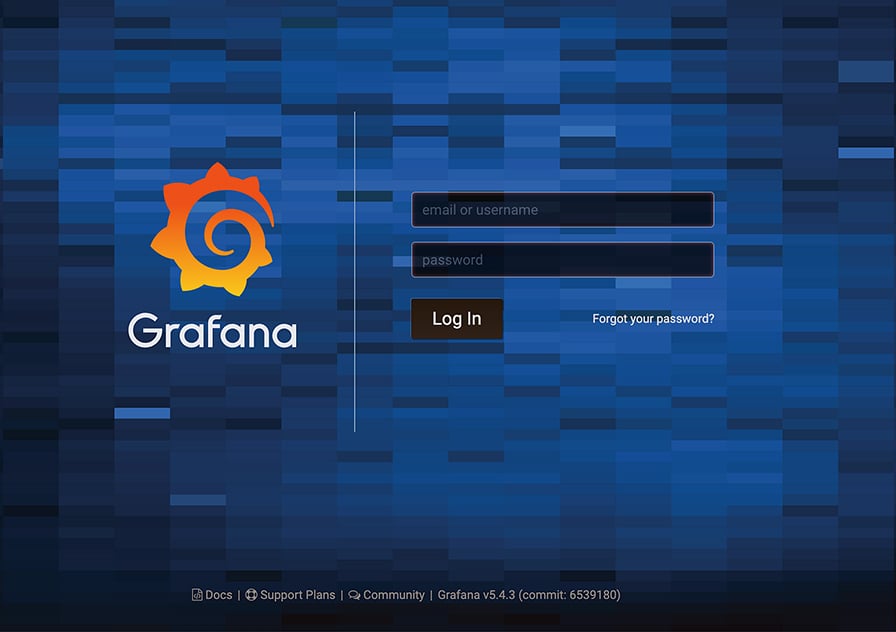
Login with the username and password you have from the previous command.
Add a dashboard
Grafana has a long list of prebuilt dashboards here.
We will use this one as it is quite comprehensive in everything it tracks.
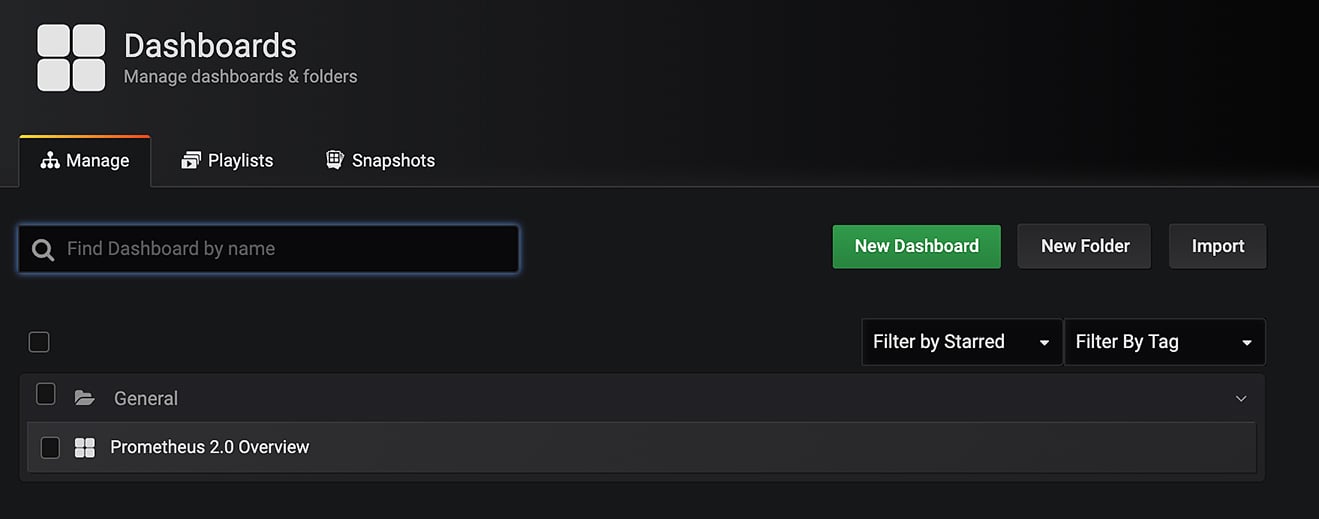
In the left hand menu, choose Dashboards > Manage > + Import
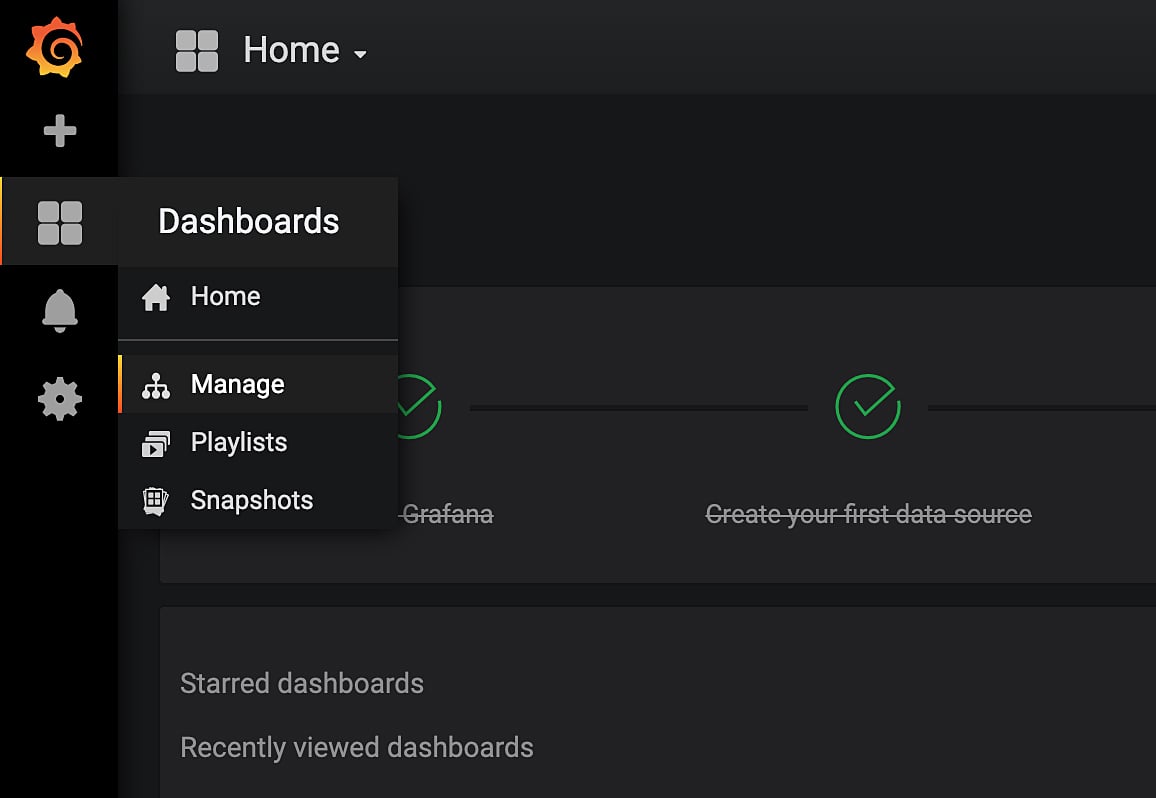
In the Grafana.com dashboard input, add the dashboard ID we want to use: 1860 and click Load.
On the next screen select a name for your dashboard and select Prometheus as the datasource for it. Then, click Import.
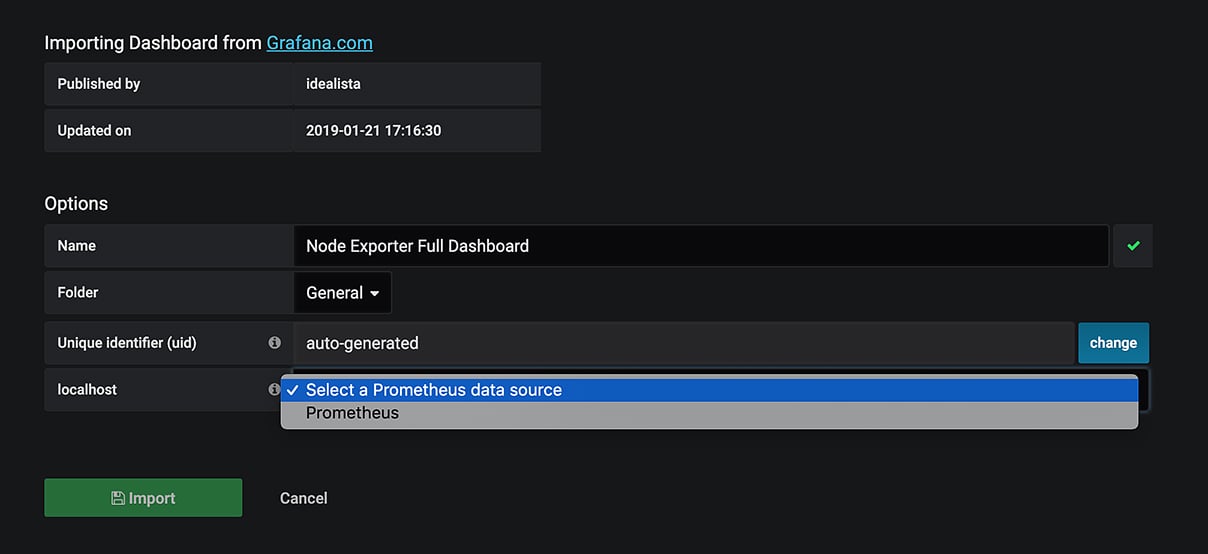
You’ve got metrics !
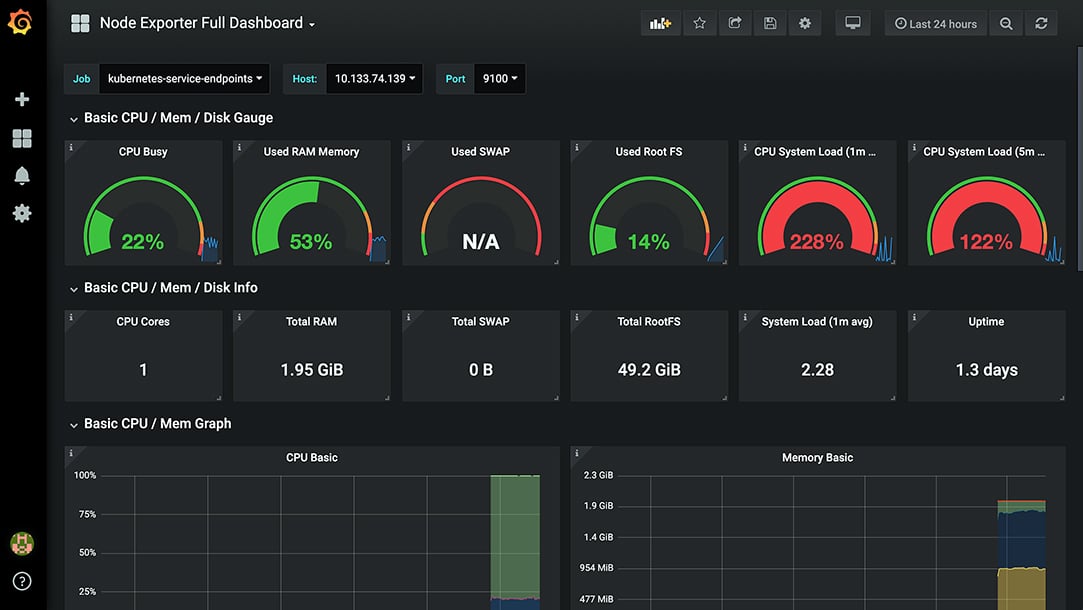
The list of metrics is extensive. Go over them and see what is useful, copy their structures and panels, and create your own dashboards for the big screens in the office!
Adding Dashboards? Automate It.
You can automate dashboard additions in a couple of ways.
In the same way we have added a data source as a config map, you can download the json, add it in a config map, and enable the dashboard sidecar.
In your values.yml file for grafana add the dashboard data to the sidecar:
sidecar:
datasources:
enabled: true
label: grafana_datasource
enabled: true
label: grafana_dashboard
This will instruct Grafana to watch for dashboard config maps.
Now apply that so it creates the sidecar:
$ helm upgrade --install grafana stable/grafana \
 -f monitoring/grafana/values.yml \
 --namespace monitoring
Release "grafana" has been upgraded. Happy Helming!
[...]
Grafana will now carry a sidecar that will watch for our dashboards.
Next we’ll create a config map for your dashboard. We’ll start with the Prometheus 2.0 Overview dashboard located here.
Download the json for the dashboard here.
Now open the json file and replace all ${DS_THEMIS} references with Prometheus. This replaces all of the datasources with the name of yours.
You can do this quickly by running:
sed -i "" 's/${DS_THEMIS}/Prometheus/g' [your-file-name].json
Now copy the json text and insert into a configmap as follows:
# monitoring/grafana/prometheus-overview-dashboard-configmap.yml
apiVersion: v1
kind: ConfigMap
metadata:
name: grafana-prometheus-overview-dashboard
namespace: monitoring
labels:
grafana_dashboard: '1'
data:
prometheus-dashboard.json: |-
[your-json-pasted-here] # Make sure it is pasted at this indent
Apply that and Grafana should pick up your new dashboard.
$ kubectl apply -f monitoring/grafana/prometheus-overview-dashboard-configmap.yml
Check back at Grafana and your dashboard should be visible now.
There is one problem with registering dashboards in this way, though. Kubernetes can only store 262,144 characters per config map. That seems like a lot, but dashboards can take up quite a bit of space.
For instance, the dashboard we used in this exercise does not fit within the limits.
Is there another way to import the dashboard?
Yes. Without the dashboard sidecar, you can add your default dashboards from grafana.com
In your values.yml file, remove the dashboard sidecar:
sidecar:
datasources:
enabled: true
label: grafana_datasource
# Remove the below lines
- dashboards:
- enabled: true
- label: grafana_dashboard
Then configure a dashboard provider & dashboards in you values.yml:
[sidecar-definition]
# Add the following
dashboardProviders:
dashboardproviders.yaml:
apiVersion: 1
providers:
- name: 'default'
orgId: 1
folder: ''
type: file
disableDeletion: false
editable: true
options:
path: /var/lib/grafana/dashboards/default
dashboards:
default:
node-exporter:
gnetId: 1860
revision: 14
datasource: Prometheus
Re-apply your helm config:
$ helm upgrade --install grafana stable/grafana \
-f monitoring/grafana/values.yml \
--namespace monitoring
Release "grafana" has been upgraded. Happy Helming!
[...]
The node exporter dashboard will now be available in your Grafana instance.
You can still upload your own json dashboards. But you will need to clone the whole chart, copy in your values.yml, place your json inside the dashboards directory, and deploy chart that way. (See here.)
A reminder, to make the process even easier, I have saved all of this in a Github repo for everyone to use. Enjoy!
Primary images by Stephen Dawson (top) and Katya Austin on Unsplash.
We have our first-ever book coming: 'Cloud Native Transformation: Practical Patterns for Innovation'. Click below to pre-order now!