Monitoring microservice systems has been a hot topic at Container Solutions for some time. Combined with our recent interest in Kubernetes we set out to give the new CoScale monitoring solution a try. CoScale is a hosted and on-premise monitoring solution with native support for Docker and Kubernetes. In the case of Kubernetes, this means it can talk to the Kubernetes master server and measure data about Kubernetes entities like Services.
A few words about why that is important. The logical and physical organisation of a microservice application can be very different. From a logical point of view the application consists of several services talking to each other. In our example we use the Socks Shop microservice reference application which consists of 14 different services.
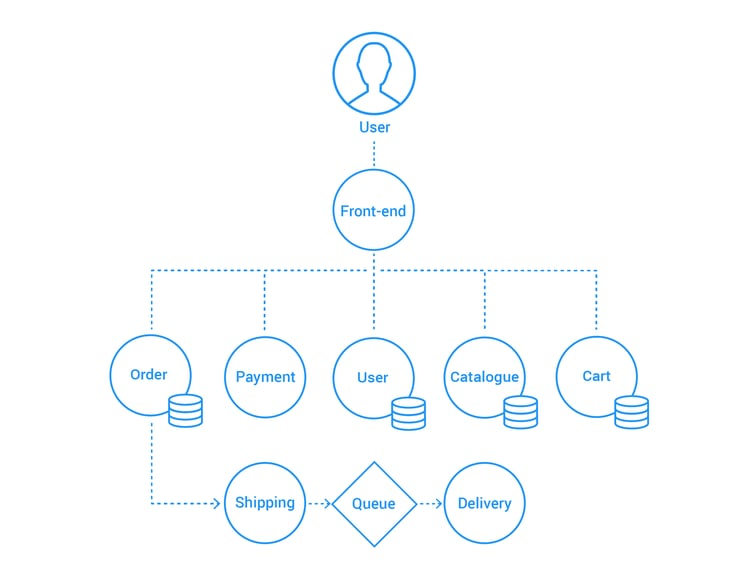
The physical representation of this application in runtime is even more complex. Each Service is implemented by a Kubernetes ReplicaSet running a number of Pods hosting containers (in this case a Pod can be considered the equivalent of a container). Every Pod belonging to a Service can run on any Node (physical or virtual machine). So a single Service will be scattered over different servers and this layout can change any time. In such a dynamic environment Pods (containers) can appear and disappear on any server all the time - so there is no point in trying to monitor them as that view wouldn’t tell us whether a particular Service like the front-end is running and healthy.
This leads us to the need to group data based on Pods that belong together. This can be done by using naming conventions or Docker labels. However when using a container orchestrator like Kubernetes that models application services a monitoring tool can tap into this data. The result can be monitoring on the right level of abstraction without using unreliable filters like naming conventions.
As my colleague Lukasz Guminski writes in his post on semantic monitoring:
“The reconfiguration of the monitoring must happen automatically. And the only way I can see it happening is if developers become actively involved in monitoring. Not actual monitoring in production, but their knowledge on how the given service should be monitored must “flow” automatically from development into production with every new release of the service.”
As CoScale aims for this kind of integration with Kubernetes we were very interested in seeing the results especially as the problem of evolving monitoring solutions catching up with evolving architectures was highlighted by Adrian Cockroft recently in his excellent talk on Monitorama 2016: https://vimeo.com/173609948
Our setup
Our Kubernetes cluster is running on 1 master and 3 worker nodes. We set it up on Google Compute Engine using the standard kube-up.sh script bundled with Kubernetes.
I already mentioned the Socks Shop application we developed with Weaveworks. It's a webshop selling used socks that is developed as a reference application for microservice applications.
CoScale needs an Agent process to be running on every machine that feeds the monitoring data into the managed backend. The Agent can run either directly on the OS, or in a privileged container. Different types of Agents can be created on the admin UI and installed on your machines by a generated command that already includes credentials, so no additional configuration is necessary. If you want to change an agent - by for example adding a plugin to it - you can do that remotely. Changing the configuration on the admin UI will update all installations of the Agent.
In our case, we ran an agent with the Kubernetes plugin on the Kubernetes master node, as well as an agent with the Docker plugin on the worker nodes. Via the Docker plugin you can then configure additional application plugins to monitor the workloads inside your containers.
Setting up your dashboards
In CoScale, you can define a variety of dashboards by combining widgets. There are also some clever features like widgets that link to other dashboards so you can create a top level dashboard which will have widgets that link to other more detailed dashboards.
I wanted to create 4 dashboards to cover all important aspects of the system:
- The Nodes dashboard shows resource usage of nodes (VMs).
- The Kubernetes dashboard shows Kubernetes core service utilization (Scheduler, DNS).
- The Socks App dashboard shows the resource usage of individual application services.
- A MongoDB dashboard showing detailed performance metrics of my MongoDB services
Basics - Monitoring (virtual) machines
This the simplest of the dashboards to explain. It shows CPU, memory, network and disk usage for each VM. On the screenshot below you can see that the Master node is running around 20% CPU all the time while the minion nodes had a few spikes when I launched 800 requests per second at them using vegeta for two minutes.
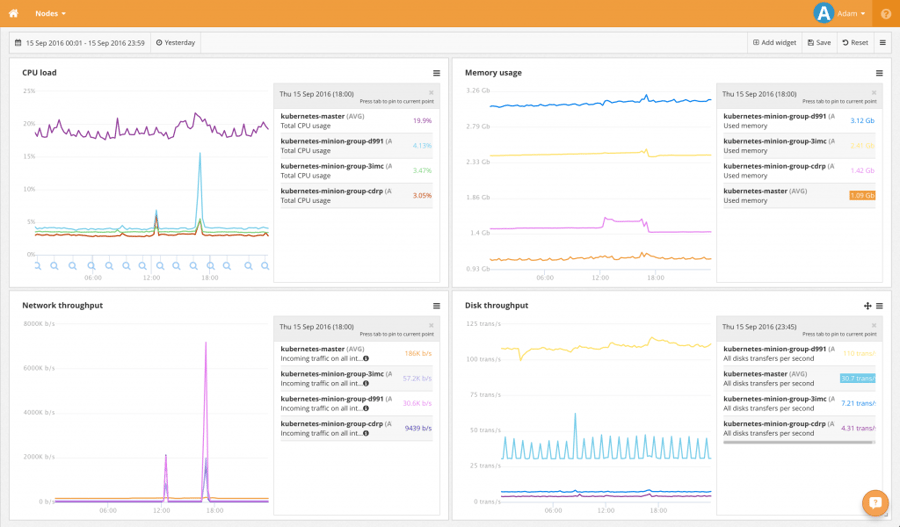
You can also play around with the layout, add or remove legends and tooltips or change the sizes of the widgets. There are also widgets to display some text and a comment widget which is pretty neat for discussing a dashboard with colleagues.
The Kubernetes dashboard
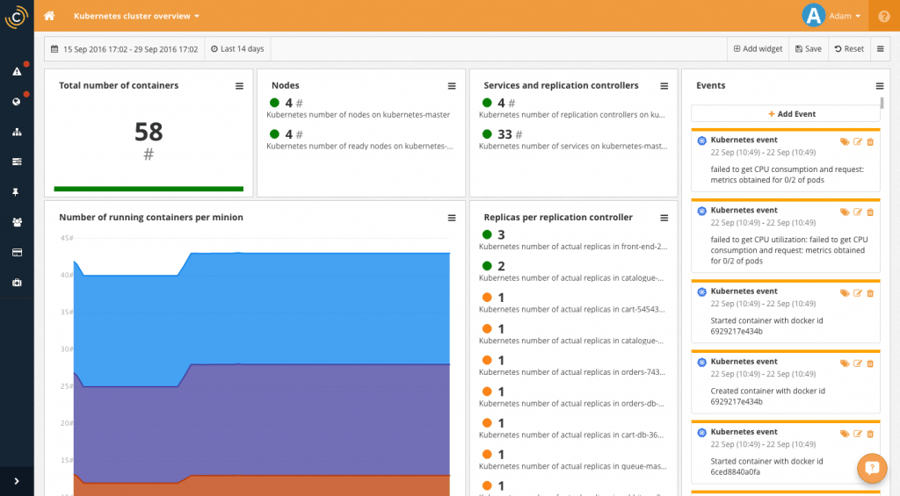
Once you have the Kubernetes plugin installed, CoScale will automatically create a number of default dashboards for you. The best one is the "Kubernetes cluster overview" which show a lot of interesting data about the cluster. Check the screenshot below, you can see a total count of Pods and their distribution over the Nodes.
My only quarrel with all this configurability is the way you have to save your changes. You have an old school "Save" button that reminded me why most webapps got rid of those these days. I kept forgetting to save my dashboards which in better cases led to annoying popups of the "Are you sure you want to leave this page" type or straight losing my work because I just forgot the browser window open and went home.
Monitoring application services
This is where we get to the semantic monitoring mentioned in the introduction. Here we are mainly interested in seeing how our application is doing on a service granularity level. I put together the CPU, Memory and Network widgets like on the Nodes dashboard but this time each line on the graph is showing a service of the application:
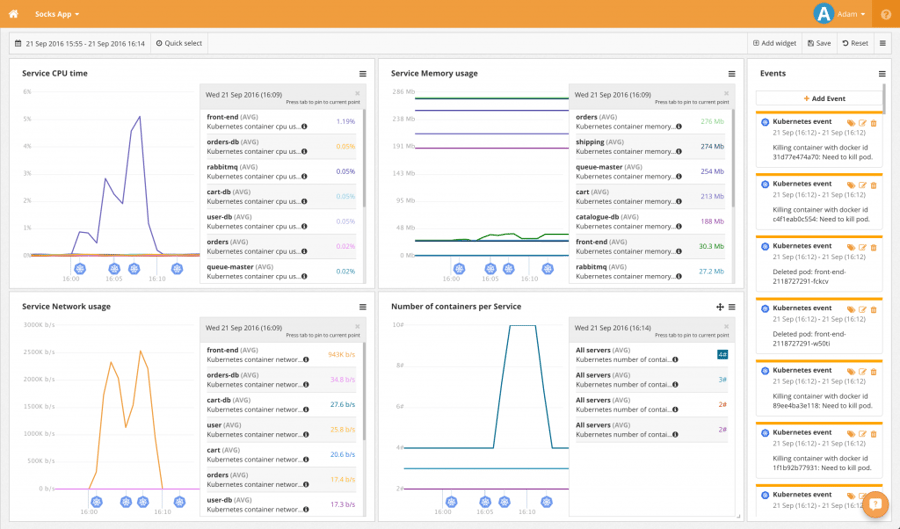
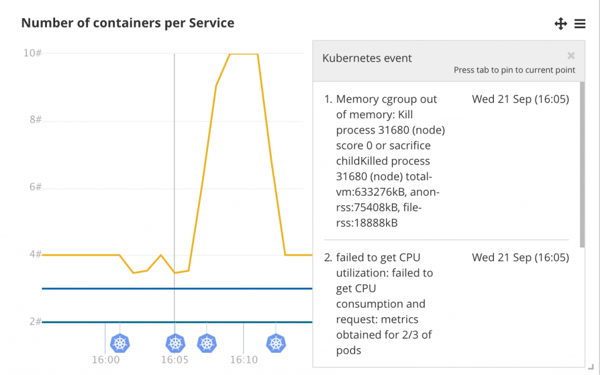
Here CoScale shows you what happened during a stress test. On the CPU and Network widgets we can see a sharp spike in utilization of the `front-end` service. You can see on the bottom right widget that the services are made up of several containers and the `front-end` service get’s scaled up during the load test. Also we can see that two of the containers crash under the load and before the autoscaling kicks in.
Below the widget CoScale shows events correlated to the graph’s timeline. Hovering over one of them show information about the decline in number of nodes. The container is killed because it overstepped it’s cgroup memory limit (specified in the Kubernetes deployment descriptor).
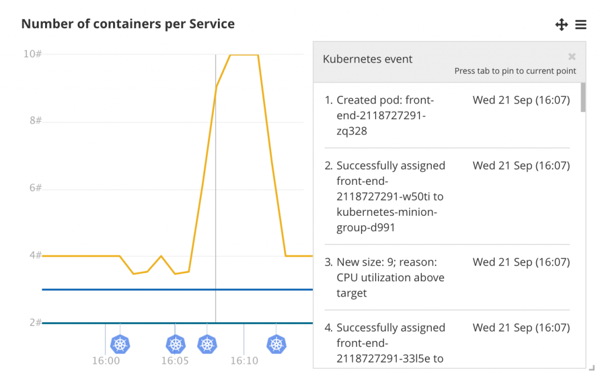
We can also see the moment when the autoscaler decides more containers are needed to handle the load on the `front-end`:
This level of visibility into the application is great. There is just one small feature missing now, which is to view a summary of resource consumption by all instances of a Service. Right now we see averages of all instances which especially in case of memory consumption is not a very useful view:
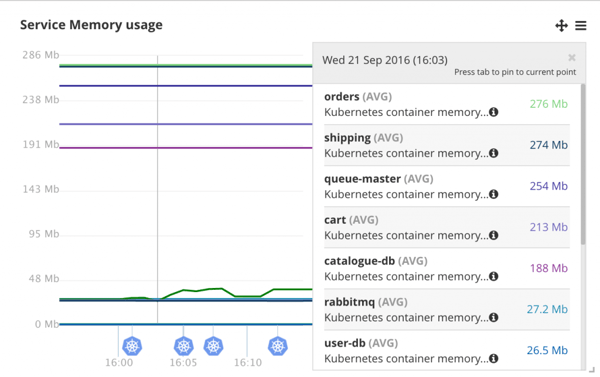
The green line with the bumps is the `front-end` service. Autoscaling doesn’t have an effect on the graph because the average memory usage by all `front-end` containers stays roughly the same. What would be useful to see on this graph is the sum of all containers’ memory usage. When I asked about this CoScale support told me that this feature is coming soon.
Monitoring MongoDB - technology specific widgets
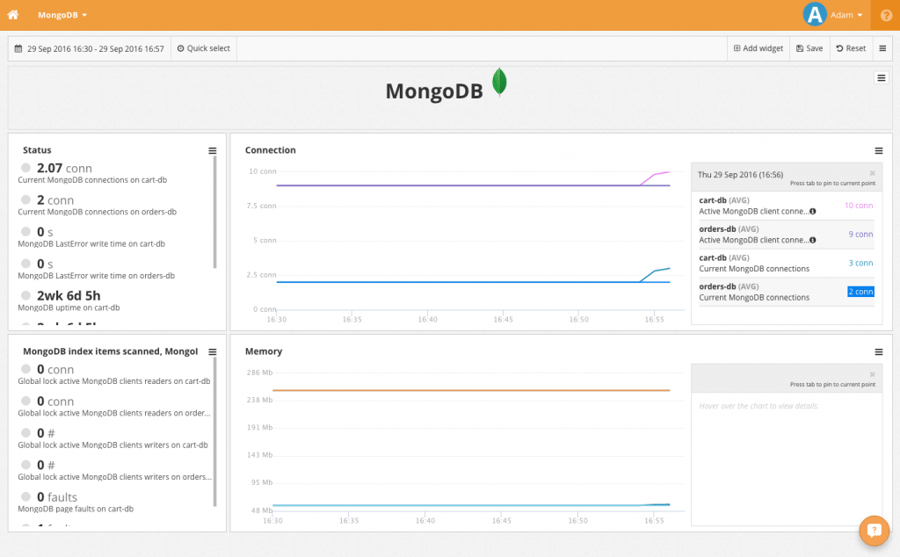
Lastly I want to show how CoScale can monitor certain types of applications using special plugins installed on the agents. We have two MongoDB databases in the Socks application so I set up a special dashboard to monitor them.
The first step is to install the MongoDB plugin on the agent which is a simple change done on the UI. This configuration update will initiate an update of the agent on every Node.
You can see the result after setting up a few widgets below. CoScale shows some useful status information like the number of timed out requests on the left. The right side widgets draw graphs for number of connections and memory consumption.
Summary
Overall CoScale delivers on its promise of a next generation monitoring tool by leveraging direct integration into the Kubernetes orchestration engine. Working on this high level of abstraction it is able to provide a semantic view on a microservice application. This can help operations staff better understand the applications being monitored and report issues to development teams in terms that are close to their thinking.
Want to know more about monitoring in the cloud native era? Download our whitepaper below.
Material referenced in this article
- Lukasz Guminski: Comments on Semantic Monitoring
- Adrian Cockcroft’s Monitorama talk
- The Socks Shop microservice reference application
- Vegeta load testing app


 Previous article
