
After acquiring Stackdriver in 2014, Google worked hard to make it the default log aggregation and monitoring solution for Google Cloud Platform (GCP). The feature set of Stackdriver is pretty good for an out of box integrated solution for GCP. It is the equivalent of CloudWatch on AWS - doesn’t have all the bells and whistles but it’s relatively cheap, integrated and gets the job done.
Just as CloudWatch, Stackdriver is both a log aggregation and monitoring solution. Stackdriver Logs let’s you browse and filter log messages coming from your applications while Stackdriver Monitoring allows you to create dashboards with pretty charts as well as alerting on thresholds. The most surprising aspect of Stackdriver is the fact that while Logs is attached to a GCP project (and can be opened from the project web console) Monitoring is a separate application linking to multiple GCP projects. This gives you the ability to create dashboards which span more projects but also leads to quite some confusion until you get used to the thinking behind it.
Google is arguably the biggest proponent of using container technology to manage your applications. They were the first to offer a container orchestration platform on their cloud in the form of Google Kubernetes Engine (GKE). As Kubernetes matured, so too has GKE. With this in mind, my expectation as a GKE user is that Stackdriver as the native monitoring solution on GCP will integrate neatly with GKE. Fortunately Stackdriver meets this expectation, but with some caveats.
Stackdriver & containers - the good parts
As soon as you start your application on top of GKE, logs going to stdout or stderr from your containers will be pushed to Stackdriver Logs, ready for you to view and filter them. The magic happens when you create a GKE cluster - it will come preconfigured with fluentd pushing logs to Stackdriver. This is a great out-of-the-box experience.
Stackdriver Monitoring will also get you off the ground quite smoothly. You will get an initial surprise when you first click on the monitoring link and your browser will open a new tab with an option to enable monitoring for your project. This makes no sense until you learn that the Stackdriver Monitoring project you just created can be used to aggregate monitoring for several GCP projects. This allows creating some quite elaborate dashboards and alerting. For example if you separate your cloud landscape into different GCP projects based on teams - you can monitor all teams’ projects on a single dashboard. As with Logging, pushing container metrics like memory and CPU usage comes out of the box. For this to work your cluster comes preconfigured with heapster running. Creating dashboards is just a matter of navigating the UI and selecting the right metrics.
Without having to install anything or touch your application code you can get decent log aggregation and monitoring dashboards.
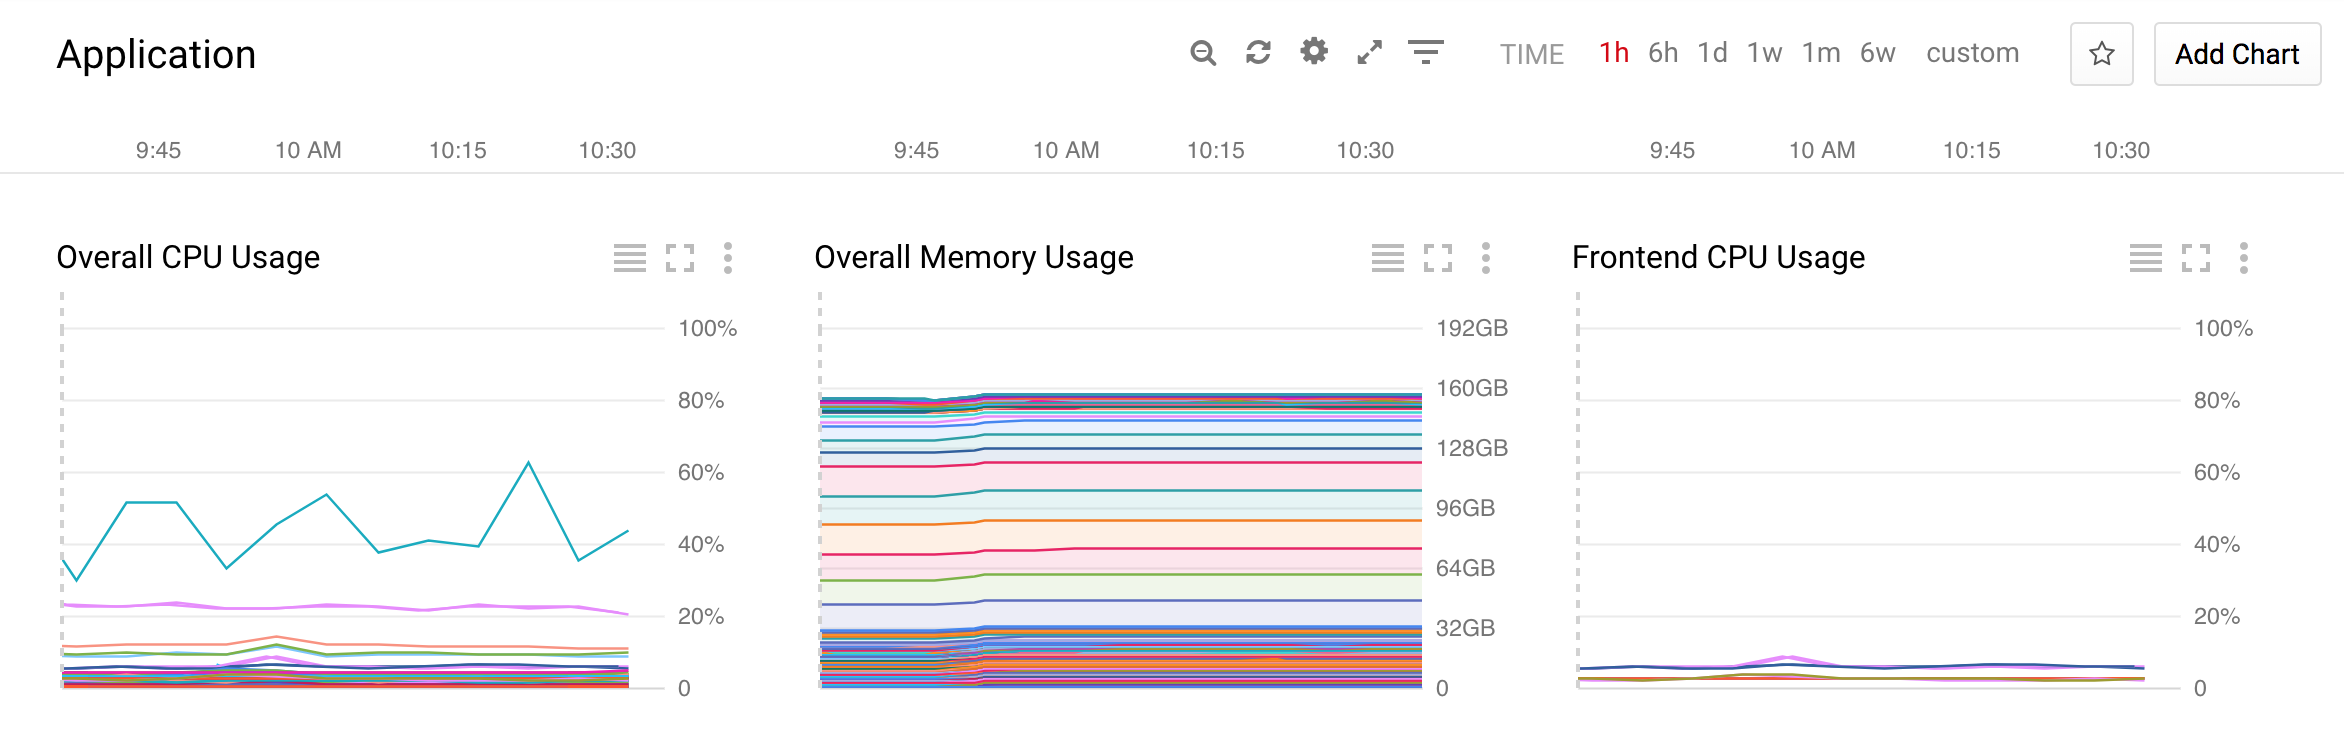 Stackdriver dashboard showing built in metrics
Stackdriver & containers - the tough parts
Once you start using Stackdriver for viewing your logs you will see that the parsing is a bit simplistic. All Stackdriver does is split your logs on newlines. This becomes really awkward for stacktraces which always span lots of lines. To improve this you can either reconfigure fluentd and change the parsing of the Docker logs or change how your application outputs logs.
The former is a more centralised solution, without the need to change all applications running on the cluster, but it's quite involved and might still be hard to come up with a parsing strategy that fits all applications running on the cluster. The documentation to configure fluentd on a GKE cluster can be found here.
There are two ways you can change your applications' logging to produce a better output in Stackdriver:
JSON formatted log messages
If you format your logs as a JSON object with the right fields Stackdriver will parse it. This will allow you to specify multiline log messages and a fine-grained log level. You can implement this on the level of your logging framework. The documentation for the format you can find a bit scattered here and here. To make your life easier here is an example message:
{
  "message": "Error Message\njava.lang.NullPointerException: NPE\n\tat adam.Log4jTester.run(Log4jTester.java:16)\n\t",
  "thread": "logTestThread",
  "severity": "ERROR",
  "sourceLocation": {
    "file": "Log4jTester.java",
    "line": "16",
    "function": "adam.Log4jTester.run"
  },
  "serviceContext": {
    "service": "myservice",
    "version": "1.0.0"
  }
}
Call the Stackdriver API
Your other option is to call the Stackdriver logging API directly. This allows you just as much control as the previous option but has a serious downside: you must prevent your application to write the log messages to stdout. Otherwise Stackdriver will receive each log message twice - once over the API and once through fluentd from the container's stdout. This will mean you won't be able to see log messages using kubectl which can be a hindrance during some debugging scenarios.
Missing metrics in monitoring and clunky custom metrics
After covering logging, let's take a look at what we are missing from the metrics monitoring part. Unfortunately there are some important metrics that Stackdriver cannot monitor out of the box (for no good reason). The strangest of these is the memory usage of cluster Nodes or any other Compute Instance (VMs). This metric simply still doesn’t exist and it’s not even a container-specific issue.
As opposed to compute instances there is a memory metric for containers. However it only expresses the amount of memory used by a container in absolute numbers. What I really need is a percentage representation (0-100) of how much the container is using of its allocated memory. I could use that to alert when the container is close to getting killed by Kubernetes for overstepping its memory limit.
Other metric types I would love to see are: number of nodes in a cluster, number of replicas for a deployment or stateful set.
Roll your own agent
Fortunately you can always fall back to writing your own agent and pushing custom metrics to Stackdriver. To achieve this you pick the programming language of your choice from the list of supported ones with an SDK, and write the code as described in the documentation.
The problem is, that the documentation doesn’t anticipate monitoring containers very much. It does mention that you must create a metric of type gke_container but the devil is in the details. I had a month-long support request with Google to figure out how to correctly push gke_container metrics to Stackdriver. Here is what I learned.
Once trying to push a metric of type gke_container you have to specify a bunch of labels in the correct way otherwise dashboard filtering won’t work correctly. You will have to gather the values for these labels from several sources.
To show how to do that exactly I created a small example application in Python: https://github.com/ContainerSolutions/stackdriver-gke-custom-metrics
As you can see it’s not that easy to get all those mandatory labels in order. Once you get them right however you can push any metrics you were missing from Stackdriver by writing a bit of code.
You also have the option to push metrics with the global type, which doesn’t require all those labels. However global metrics didn’t appear on our dashboards when we applied Stackdriver’s Group based filtering. Google Support instructed us to switch to using gke_container metrics instead.
The whole implementation of the custom metrics feels like Stackdriver engineers quickly exposed some internal functionality that was never designed to be used by people not familiar with the internal code. As labels are only used for filtering metrics, I don't see any good reason why I need to set the namespace_id for project_id-based filtering to work.
I would like to see custom metrics become first class citizens like they are in AWS CloudWatch.
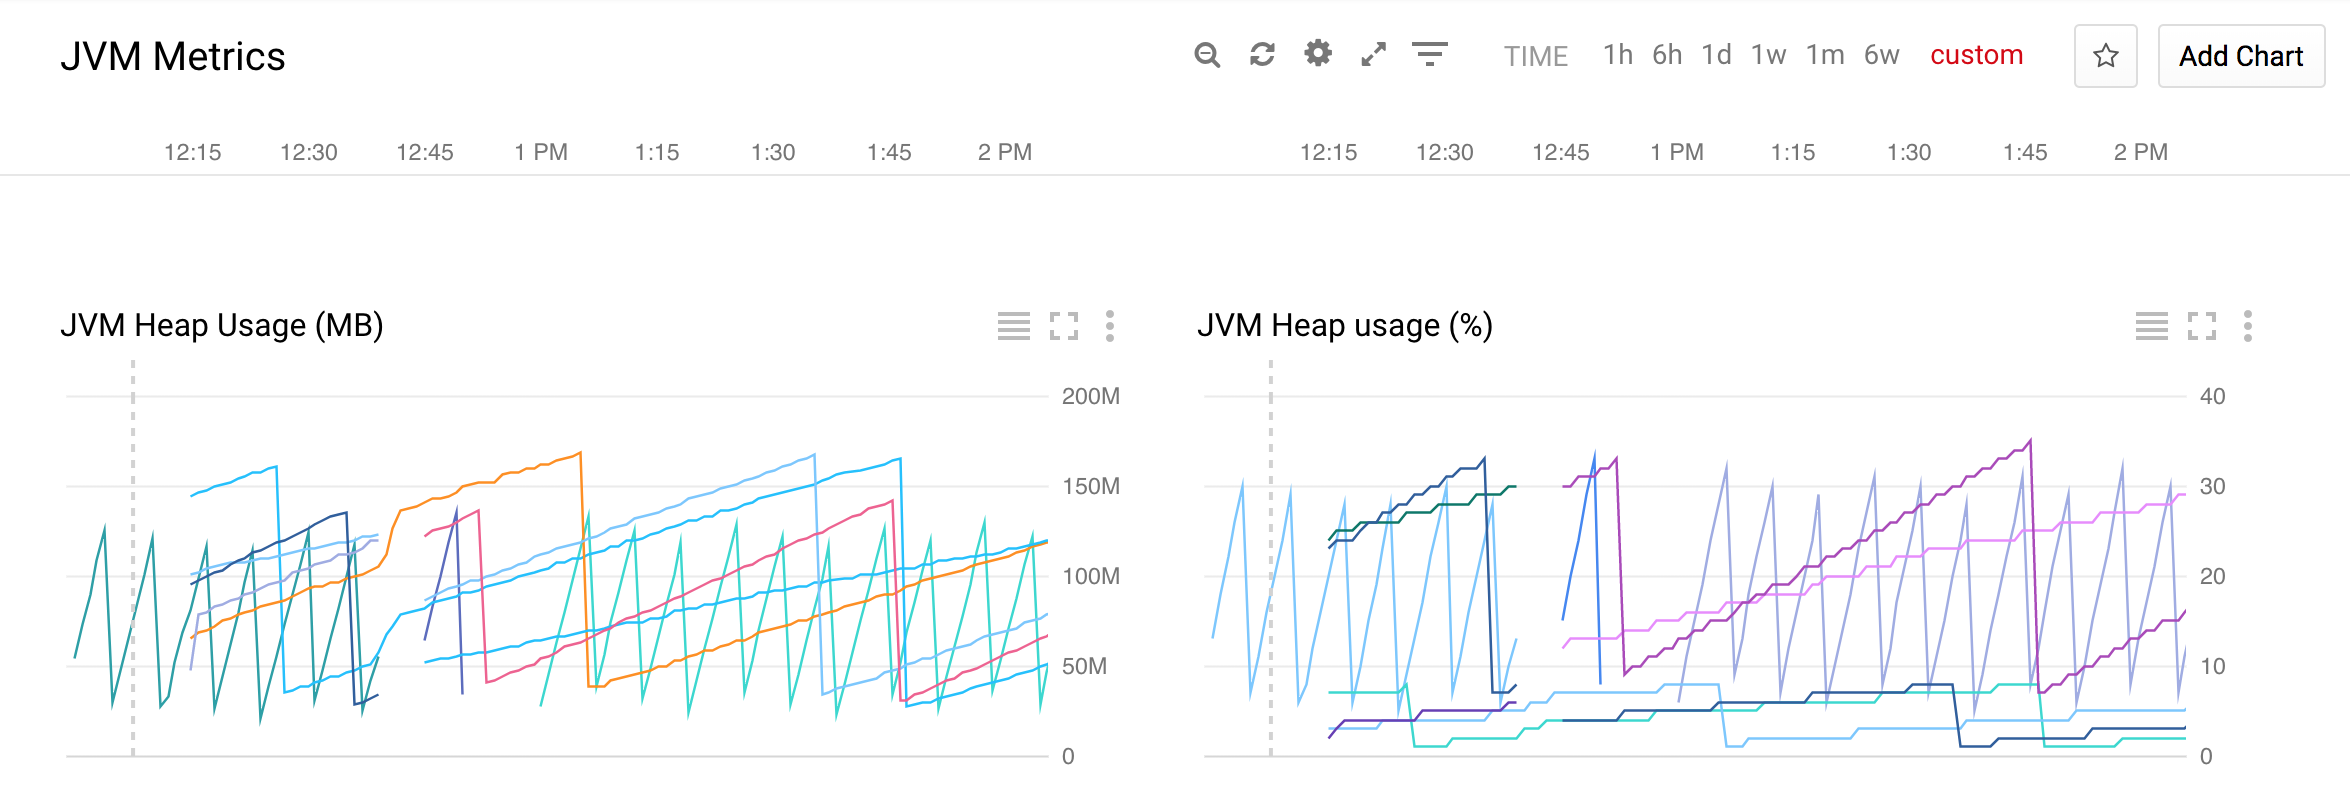 Stackdriver dashboard showin custom metrics
Deploying the agent
Once you are done writing the agent which pushes the custom metrics, you need to deploy it to your GKE cluster. There are 3 ways you can achieve this:
Sidecar container
This is a deployment pattern where you run the agent container in the same Pod as the container you are monitoring. It has the advantage of easy access to all ports and files of the monitored container. It also results in the simplest agent code as it only has to concern itself with monitoring a single container. The downside is that whenever the agent changes, all Pods that contain it have to be redeployed, which mean potentially all your applications.
Centralised agent
You can a single centralised agent which can discover Pods that need monitoring using the Kubernetes API server. It iterates over all monitored Pods, gathering metrics data and pushes the data to Stackdriver. The upside is easy deployment as you only have to create a single Kubernetes Deployment and updates are a non-issue. The downside is increased network traffic from talking to all your Pods on the cluster regularly. You will have to judge based on the number of Pods whether this is a problem. Note that Stackdriver recommends pushing data only once a minute. Another downside is access to the monitored Pod - communication must be network based (or using exec which is not pretty) and all necessary ports have to be exposed. Make sure to talk to Pods directly and not to some Service which load-balances between multiple Pods.
Node agent
Running a privileged container on every node which has access to all Pods running on that node can be a good compromise having most of the pros of the centralised agent solution but without the mentioned downsides. This is indeed the solution employed by many monitoring solutions such as Datadog. The Kubernetes DaemonSet makes it easy to deploy one instance of the same Pod to each Node. The downside of this solution is that it's more complex than the previous two, because you will have to implement logic that finds the Pods running the Node where the agent instance is running.
Summary
There is a lot of good out-of-the-box functionality for monitoring GKE clusters and applications with Stackdriver but it’s easy to hit the limits. Custom metrics help work around many of these limitations if you can spare the work of building and deploying your own agent. Still I would like to see more GKE related metrics out of the box and less clunky way to push custom metrics. Fortunately I already heard rumours that Google is building new GKE integration functionality, so I might see some of my wishes come true in 2018.
Want to know more about monitoring in the Cloud Native era? Download our whitepaper below.