Continuous delivery is becoming a standard, if you implement the right process you get a predictable deployment. When a change is made in the code, most of the time the build, test, deploy and monitor steps are followed. This is the base for anyone willing to apply automation to their release process.
If a failure is detected during the monitoring phase, then an operator has to verify and rollback the failing release to the previous known working state. This process is time consuming and not always truthful since it requires someone to keep an eye on the monitoring dashboard and react to it.
If the team is well structured and applies the devops way of working, then there will be someone on duty who receives an alert when something goes wrong. Alerts are triggered based on metrics, but still, after receiving the alert, the person on duty has to turn on their laptop (if not on-site), take a look at the graph, think for a moment, realise that the issue is coming from the last release and decide whether or not there is a need to roll back. If you step back and think about it, a significant amount of time was wasted during the process, just because a release failed and nobody kept an eye on it. What if you could automate this process?
In this blog post, I will provide some basic knowledge about Kubernetes deployment and how you can make it smarter using Helm and its plugin capabilities to control the rollback of a release, based on Prometheus metrics.
Some basics about Helm and Kubernetes deployment
If you are using Kubernetes, most of the time you store your configuration manifest into your application repository. Then during the deployment phase, run the kubectl apply -f ./manifest.yaml command to apply your configuration to the cluster. Following this practice is usually good but requires creating one manifest per application. To simplify this process the team behind Deis (now part of Microsoft) created Helm.
Helm is a Kubernetes package manager which brings templating and controlled release to the next level. It is getting a lot of attraction lately since it simplifies the release process of applications. If you want to know more about Helm, I invite you to read the getting started guide: https://docs.helm.sh.
With a single command, you can release an application:
$ helm upgrade -i my-release company-repo/common-chart
In the above example, I assume that the company-repo/common-chart has already been created.
Then, if you want to rollback to a previous version:
$ helm rollback my-release
Simple isn't it?
Now that we can upgrade and rollback a release, we can jump on the next step: rolling back based on Prometheus metrics.
Monitoring a release, rollback on failure
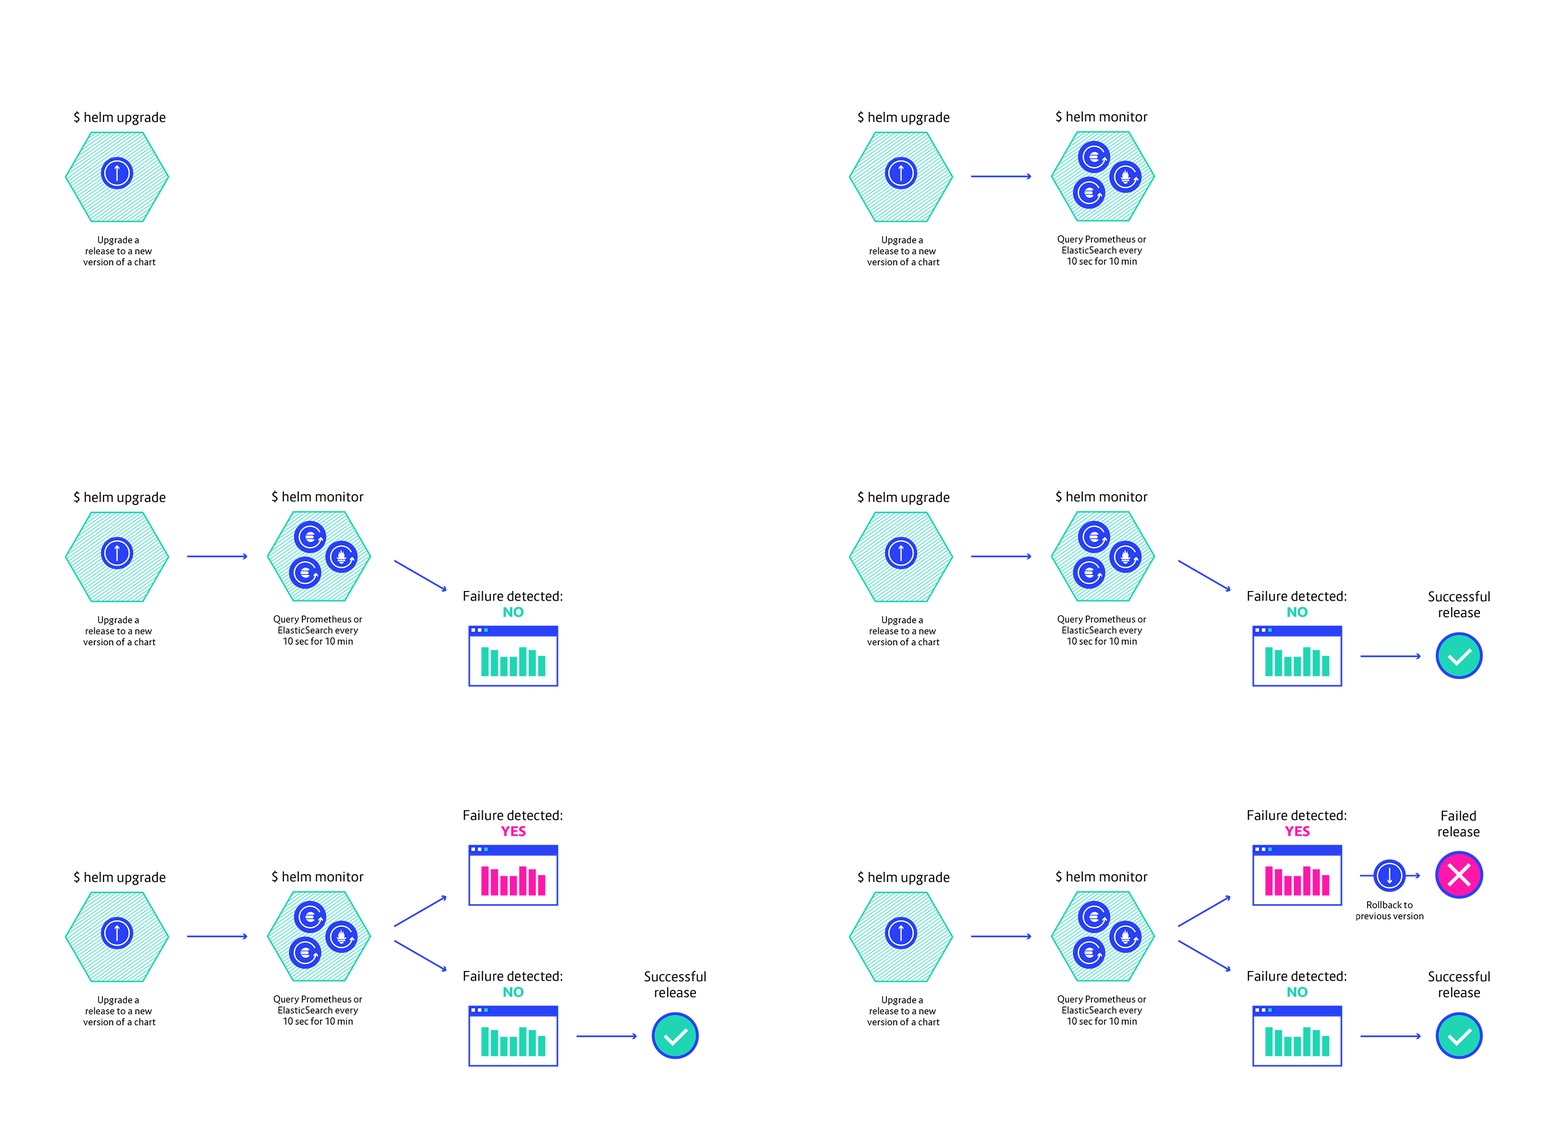
Few days ago I released a Helm plugin called helm-monitor. This plugin which, as simple as it sounds, queries a Prometheus or ElasticSearch instance at a regular interval. When a positive result is returned, the application assimilate it as a failure and initiates a rollback of the release.
Below are the steps to follow to monitor a release using Helm via the helm-monitor plugin.
In this example, it is required to have direct access to the Prometheus instance (using kubectl port-forward can be handy if testing locally).
Install the plugin:
$ helm plugin install https://github.com/ContainerSolutions/helm-monitor
Upgrade your release with a new version of the application:
helm upgrade -i my-release ./charts
Since the upgrade has started, we can now monitor our release by querying Prometheus. In the following example, a rollback is initiated if the 5xx error rate is over 0 as measured over the last 5 minutes:
helm monitor prometheus --prometheus=http://prometheus my-release 'rate(http_requests_total{code=~"^5.*$"}[5m]) > 0'
By default, helm-monitor runs a query every 10s for 5 minutes. If no results are found after 5 minutes, then the monitoring process is stopped.
Click on the screen below to see a rollback initiated by failure:
A complete example on how to use helm-monitor is available on Github.
So far, this plugin only supports Prometheus and ElasticSearch queries, but you could easily plug in another system. An ElasticSearch query could look like this:
helm monitor elasticsearch --elasticsearch=http://elasticsearch my-release 'status:500 AND kubernetes.labels.app:my-release AND version:2.0.0'
To sum up
When it comes to detecting failure, even if accurate, humans are quite slow to recognize patterns. This is why moving toward an automated way to recognize common failure pattern and act on it during and after a release become necessary. With this approach, releasing applications using Helm together with the Helm Monitor plugin, you can save some time and focus on what matters: delivering high quality product.
I hope this information could help you to improve your delivery process, if you have any questions, feel free to ask.
Want to know more about monitoring in the cloud native era? Download our whitepaper below.


 Previous article
