
The pandemic accelerated the economic transition to digital-native services and products. Across industries and categories, organisations aspired to scale their development performance in the face of growing talent shortages and competition. In a globally established DevOps community, including shared practices and a ferocious market for dedicated DevOps tools and technologies, large-scale surveys provide a useful outside perspective to benchmark their team’s performance and to evaluate options to improve.
2021 has seen the publication of three thoroughly researched reports covering the field of DevOps and software delivery. Each report targets the same firmographics and largely applies comparable analytical methods. As a result, it is an insightful exercise to compare those reports side by side to look for overlapping results as an indicator for well-established standards and clear trends. This piece reviews the three most recent reports on the state of DevOps: Puppet State of DevOps, Google Cloud Accelerate State of DevOps, and Humanitec State of DevOps Benchmarking Analysis (hereafter Puppet, Google and Humanitec respectively).
All three reports use the software development performance metrics popularized through the Accelerate book by Nicole Forsgren, Jez Humble, and Gene Kim. Due to their conceptual strength, those metrics evolved into well-established indicators of team performance, known as the DORA metrics: delivery lead time, deployment frequency, mean time to restore, and change failure rate.
Two central aspects make them effective. First, users tend to optimise against metrics, not customer experience. This is a common problem of all metrics. The combination of the four metrics, however, balances one-sided manipulations. For example, if a team unreasonably pushes the deployment frequency, it will negatively affect the change failure rate. Second, smart metrics account for the impact of work, not the presence of work. Mean time to restore, for example, may require large amounts of uneventful and often unnoticed work in preparation for an actual incident. Effective metrics measure the results with the end-user customer in mind. Fast time to restore means a better customer experience.
Customer demands change constantly and organisations must adapt with the ability to deliver and operate software quickly and reliably. Measuring software delivery performance on result-oriented, system-level metrics provides dependable insights into the state of DevOps.
Key findings across software delivery performance
Software delivery performance metrics are alphanumeric in nature. All reports cluster the survey results into three groups representing high, medium, low performers. The Humanitec report uses a comprehensive scoring system to baseline respondents in the four cohorts. This approach allows the authors to zoom in on performance trends within each cohort. (Example: As much as 50% of organisations generally considered low performing manage to achieve a good mean time to recover of less than one day.)
The system-level metrics are reasonably complex to average out the effects of single tools or practices. While it is always debatable where to draw the line between high and average performance the tiering is reasonably evident. Google calculates a probability to state the relative performance difference between low and high-performing teams which highlights impressive results but may leave readers perplexed. (“Top performers have 6.570x faster lead time from commit to deploy compared to low performers.”)
The overall picture, however, is unambiguous across all surveys reviewed. Top-performing organisations set a clear standard for competitiveness. In all four metrics, top-performing organisations constitute a substantial proportion of companies surveyed. It is not just a few celebrity brands that outperform everyone else anymore. Top performance has become the de facto standard for software development teams across industries and regions.
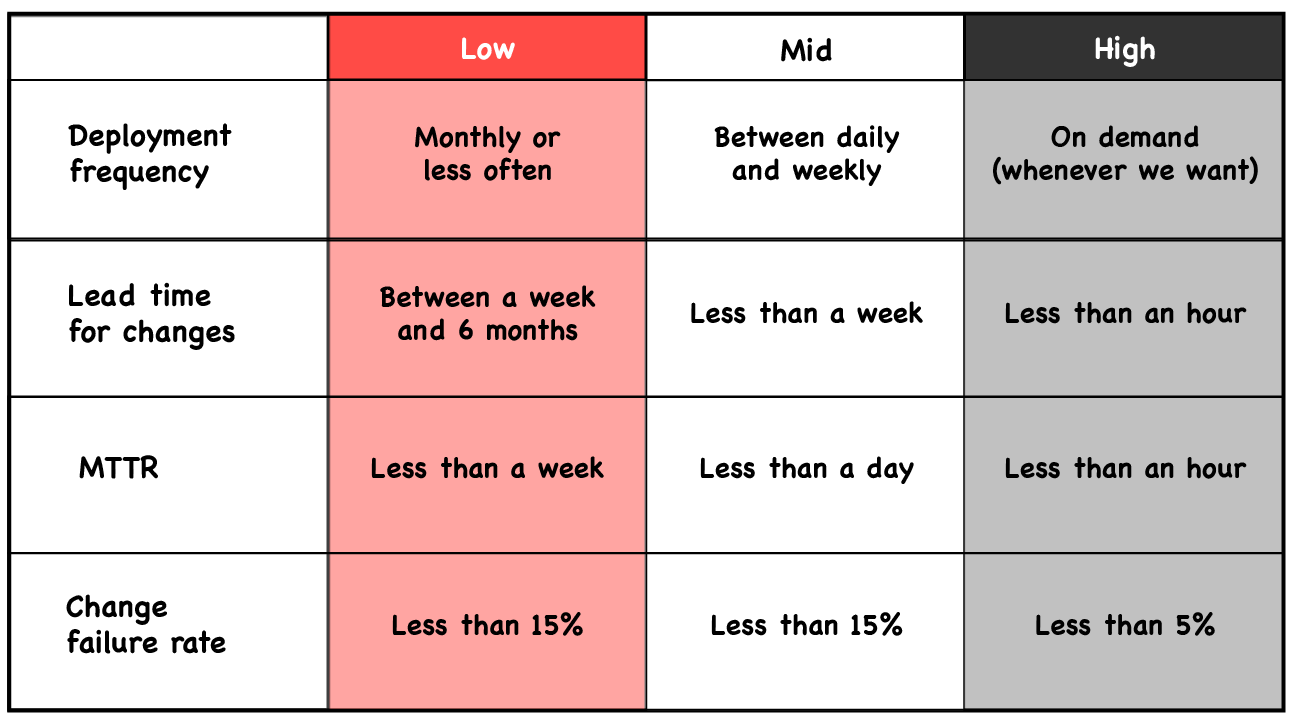 Image: Software Delivery Performance Metrics and Outcome Tiers from Puppet
Deployment Frequency measures how often the software organisation deploys code to production or releases it to the end-users. It is a proxy that bundles interconnected and desirable effects. For example, smaller batches tend to get shipped more often which also reduces risk. Deploying every day characterises high-performing teams. A subgroup of high performers go as far as to deploy on-demand. Low performers are far behind reporting deployment frequencies between several weeks and or only a few times a year.
Lead Time for Changes refers to the time it takes code to go through all stages from committed through tested to successfully delivered to production. Almost half of all software delivery organisations set the bar high with less than 1 day, sometimes only minutes, of lead time resulting in an ability to improve customer experience exceptionally fast. Even mid performers run far behind with 25% of all respondents spending between a day and a week delivery code. An additional 20% needs between one week and a whole month lead time, according to Humanitec.
Mean time to restore (or recover) service measures the time it takes to restore service after an incident or a defect that impacts users. While most software organisations can recover their service in less than 1 day. Top performers, representing almost 50% of teams surveyed, get their service back to work in less than 1 hour. With company value streams shifting to digital services, every second out of service counts and costs money. This is a clear wake-up call for those who continue to struggle with several days or weeks of recovery time. Time to restore service of fewer than 1 day is the de facto standard.
Change failure rate refers to the number of flawed changes released to production that result in degraded service for end-users and require remediation. Puppet uses a very ambitious threshold of 5% to identify best-performing teams. Humanitec is more inclusive and considers change failure rates under 15% as top performances. The trend, however, is clear. Over ¾ of all organisations can limit the proportion of faulty code to 15% or less. Teams who experience failures in 16% or more of their deployments need to improve urgently as the majority of development organisations are far ahead. Note that a high change failure rate has a painful ripple effect. Every intervention after release to production is ineffective action that bottlenecks other tasks and doesn’t advance value for the customers.
How to improve
All reports unanimously show that top performance in software development is not a theoretical ambition but a practised reality. High-performing teams exist across industries and regions and set the standards for the competitors in their respective fields. Those development organisations whose metrics indicate mid or low performance need to adapt quickly and substantially to catch up with the performance leaders.
DevOps is a dynamic set of tools and practices. Different organisations develop different arrangements to implement DevOps and transform software delivery. Accordingly, no “silver bullet” exists and no single technology alone will allow software development teams to promote themselves to the top-performing group.
Rather, the reviewed research recommends a breadth of perspectives and approaches to addressing DevOps performance holistically. What all recommendations have in common is a sincere emphasis on enabling better communication, knowledge transfer, and customer focus across teams as a basis for better performance. This review highlights selected recommendations that Container Solutions’ engineering experts consider most relevant based on their transformation depths/leverage.
Balance Cognitive Load
Cognitive load refers to the fact that each team member (as much as the whole team) can only bear a limited range of task complexity for optimal performance. Anything more than the optimal cognitive load for a team turns into a distraction. It prevents teams from focussing on their key responsibilities, and from utilising their capabilities effectively. The strength of the concept is its intuitive dual adaptability on both the individual level and the team level. Engineering managers may ask themselves, “are my team members’ capabilities being utilised most effectively?”
Average-performing teams commonly find themselves spun in meaningless tasks they need to perform to get their intended work done. Great teams work at optimal cognitive load. Internal developer platforms help achieve this as they abstract away operational tasks and enable developer self-service. Effective internal developer platforms allow teams to navigate the right balance between restricting abstraction and excess cognitive load. Software development teams who strive to work at the ideal cognitive load are ready for top performance.
Reflect on Terminology
It is strongly recommended to differentiate between practice and the term. While many organisations did implement (or plan to do so) DevOps teams, success doesn’t come with the name. The DevOps concept invites variations and adaptations through implementation. In complex environments, the key is the clear communication of responsibilities. An organisation may choose to use more exciting “new” team denominations or familiar-sounding vocabulary. In any case, what matters is a clear and common understanding of tasks and responsibilities within teams and across teams. Ambiguity and lack of transparency create organisational friction that impedes performance.
Improve Documentation
It’s easy to see why this is a love-hate topic for developers and engineers. Great documentation is a rather intangible result of great software delivery. Hence, this service often gets overlooked. However, Google brings forward compelling evidence that improved documentation correlates with improved performance. It also increases the probability of success in implementing new practices, such as Site Reliability Engineering (SRE), reliability targets, or security practices.
Three questions help to self-assess the current quality of documentation:
- Does it help accomplish their goals?
- Is it accurate and adequate?
- Is it findable/accessible when needed?
Those teams who aspire to improve documentation quality are advised to integrate documentation as a continuous practice in their software delivery process and to take pride in keeping the documentation content relevant and reliable.
Develop a Product Mindset
Software developers must focus on their customer’s needs to build products that are both useful and delightful to the end-user. At the same time, software developers are themselves customers of the development platform. Therefore, building cloud-native developer platforms with a product mindset is essential.
Product mindset refers to a set of processes used to identify, understand and prioritise problems faced by a known set of customers, and then systematically build and validate solutions that are expected to substantially improve the customers’ situation. Platform teams must be receptive to developers’ needs. Product mindset is a servant approach to technology that doesn’t care about shiny new tech but focuses on solutions that enhance their customers’ (i.e. the development team) ability to work more productively and to ship better software faster.
Introduce SRE practices
Site Reliability Engineering is a concept famously introduced by Google and soon adopted by the industry to broaden its focus. Organisations with mature products are faced with a dual challenge. On one hand, customers demand constantly improving products with more attractive experiences and functionality. On the other hand, the changing application needs to run reliably on an unprecedented scale.
Both aspects converge in the customer’s overall experience with the product. SRE design principles directly contribute to software delivery performance indicators. The user-centric culture of emergent learning and psychological safety, exemplified in practices like blameless postmortems, aligns seamlessly with the growth-oriented culture of top software development teams. An application design that is not carefully maintained sooner than later backfires, deteriorating software delivery performance and customer experience. Conversely, this means that SRE paves the way for software development teams to top performance.
Conclusion—invest in people and platforms
It shouldn’t come as a surprise that results of software delivery performance analysis from all three reports converge. After all, the analysis draws on data from the same group of organisations and individuals that represent the global software development community. Software developers work with the same portfolio of technologies, are exposed to the same thought leaders, and are well connected through social media. Many of them already work with internal developer platforms of different shapes and sizes. The global DevOps community is in constant exchange, through conference presentations, blog posts, tutorials, and other genres of knowledge transfer.
The exchange of knowledge to share experience and learn from colleagues indicates a culture where people can thrive. Other important aspects of generative work culture include the ability to collaborate openly under the condition of psychological safety as much as allowing developers to work to the best of their ability. Strong organisations invest in people and platforms to allow them to build a culture of top performance.