
Prometheus is a simple and effective open-source monitoring system. In the years after we published the article Monitoring Microservices with Prometheus, the system has graduated from the Cloud Native Computing Foundation (CNCF) and became the preferred monitoring tool for distributed systems. One of the reasons for this, as mentioned in our previous article, is its intuitive simplicity. It doesn’t try to do anything fancy. It provides a data store, data scrapers, an alerting mechanism and a very simple user interface.
Deploying Prometheus and the associated Alertmanger tool can be a complicated task, but there is tooling available to simplify and automate the process, such as the Prometheus Operator project.
In this blog post, we explain what operators are in general, how the Prometheus operator works and how to configure it to best use Prometheus and Alertmanager.
Operators
As stated in our article Kubernetes Operators Explained, operators are a kind of software extension to Kubernetes. They provide a consistent approach to handle all the application operational processes automatically, without any human intervention, which they achieve through close cooperation with the Kubernetes API.
Operators are built on two key principles of Kubernetes: Custom Resources (CRs), implemented here by way of Custom Resource Definitions (CRDs) and custom controllers. A CR is an extension of the Kubernetes API that provides a place where you can store and retrieve structured data—the desired state of your application. Custom controllers are used to observe this CR and with the received information take actions to adjust the Kubernetes cluster to the desired state.
The Prometheus Operator
The main purpose of this operator is to simplify and automate the configuration and management of the Prometheus monitoring stack running on a Kubernetes cluster. Essentially it is a custom controller that monitors the new object types introduced through the following CRDs:
- Prometheus: defines the desired Prometheus deployments as a StatefulSet
- Alertmanager: defines a desired Alertmanager deployment
- ServiceMonitor: declaratively specifies how groups of Kubernetes services should be monitored
- PodMonitor: declaratively specifies how groups of pods should be monitored
- Probe: declaratively specifies how groups of ingresses or static targets should be monitored
- PrometheusRule: defines a desired set of Prometheus alerting and/or recording rules
- AlertmanagerConfig: declaratively specifies subsections of the Alertmanager configuration
Why the Prometheus Operator
As expressed before, using the operator can drastically reduce the effort to configure, implement, and manage all the components of a Prometheus monitoring stack. It also provides dynamic updates of resources, like alerting and/or Prometheus rules, with no downtime.
Using the introduced CRDs is relatively straight forward, and a turn key solution for adopting operational best practices for this stack. Furthermore, this approach makes it possible to run multiple instances, even with different versions of Prometheus.
Using the Prometheus Operator
Prerequisites
To follow the examples shown in this post, it is necessary to meet the following requirements:
- Kubernetes cluster: For testing purposes, we recommend using Kind to run a local cluster using Docker containers, Minikube can be used as an alternative
kubectlcommand-line tool: installed and configured to connect to the cluster- A web application exposing Prometheus metrics: We’re using the microservices-demo, which simulates the user-facing part of an e-commerce website and exposes a
/metricsendpoint for each service. Follow the documentation to deploy it on the cluster
Deploy the Operator
We start by deploying the Prometheus Operator into the cluster. We have to create all the CRDs that define the Prometheus, Alertmanager, and ServiceMonitor abstractions used to configure the monitoring stack—as well as the Prometheus Operator controller and Service.
This can be done using the bundle.yaml file from the Prometheus Operator GitHub repository:
kubectl apply -f https://raw.githubusercontent.com/prometheus-operator/prometheus-operator/master/bundle.yaml
First we verify that all the CRDs were created:
kubectl get crds
The output should be similar to this:
NAME                                        CREATED AT
alertmanagerconfigs.monitoring.coreos.com   2021-04-20T19:34:44Z
alertmanagers.monitoring.coreos.com         2021-04-20T19:34:57Z
podmonitors.monitoring.coreos.com           2021-04-20T19:35:00Z
probes.monitoring.coreos.com                2021-04-20T19:35:01Z
prometheuses.monitoring.coreos.com          2021-04-20T19:35:06Z
prometheusrules.monitoring.coreos.com       2021-04-20T19:35:11Z
servicemonitors.monitoring.coreos.com       2021-04-20T19:35:12Z
thanosrulers.monitoring.coreos.com          2021-04-20T19:35:14Z
Then we check that the operator was created in the current namespace (default) and the pod is in the Running state:
kubectl get deploy NAME READY UP-TO-DATE AVAILABLE AGE
prometheus-operator 1/1 1 1 5m59s
kubectl get pods
NAME                                   READY   STATUS    RESTARTS   AGE
prometheus-operator-5b5887c64b-w7gqj   1/1     Running   0          6m1s
Finally, we confirm that the operator service has also been created:
kubectl get serviceNAME TYPE CLUSTER-IP EXTERNAL-IP PORT(S) AGE
prometheus-operator ClusterIP None <none> 8080/TCP 8m25s RBAC Permissions
The Prometheus server needs access to the Kubernetes API to scrape targets and reach the Alertmanager clusters. Therefore, a ServiceAccount is required to provide access to those resources, which must be created and bound to a ClusterRole accordingly:
apiVersion: v1
kind: ServiceAccount
metadata:
  name: prometheus
---
apiVersion: rbac.authorization.k8s.io/v1
kind: ClusterRole
metadata:
  name: prometheus
rules:
- apiGroups: [""]
  resources:
  - nodes
  - nodes/metrics
  - services
  - endpoints
  - pods
  verbs: ["get", "list", "watch"]
- apiGroups: [""]
  resources:
  - configmaps
  verbs: ["get"]
- apiGroups:
  - networking.k8s.io
  resources:
  - ingresses
  verbs: ["get", "list", "watch"]
- nonResourceURLs: ["/metrics"]
  verbs: ["get"]
---
apiVersion: rbac.authorization.k8s.io/v1
kind: ClusterRoleBinding
metadata:
  name: prometheus
roleRef:
  apiGroup: rbac.authorization.k8s.io
  kind: ClusterRole
  name: prometheus
subjects:
- kind: ServiceAccount
  name: prometheus
  namespace: default
Add the above to a manifest file rbac.yaml, then apply:
kubectl apply -f rbac.yamlCheck that the role was created and bound to the ServiceAccount:
kubectl describe clusterrolebinding prometheusName: prometheus
Labels: <none>
Annotations: <none>
Role:
Kind: ClusterRole
Name: prometheus
Subjects:
Kind Name Namespace
---- ---- ---------
ServiceAccount prometheus default
Deploy and Configure
Prometheus
After creating the Prometheus ServiceAccount and giving it access to the Kubernetes API, we can deploy the Prometheus instance.
Create a file prometheus.yaml with this content:
apiVersion: monitoring.coreos.com/v1
kind: Prometheus
metadata:
  name: prometheus
spec:
  serviceAccountName: prometheus
  serviceMonitorNamespaceSelector: {}
  serviceMonitorSelector: {}
  podMonitorSelector: {}
  resources:
    requests:
      memory: 400Mi
This manifest defines the serviceMonitorNamespaceSelector, serviceMonitorSelector and podMonitorSelector fields to specify which CRs to include. In this example, the {} value is used to match all the existing CRs. If we want for instance to match only the serviceMonitors in the sock-shop namespace we could use the following matchLabels value:
serviceMonitorNamespaceSelector:
    matchLabels:
      name: sock-shop
Apply the file:
kubectl apply -f prometheus.yamlCheck that the instance is in the Running state:
kubectl get prometheusNAME VERSION REPLICAS AGE
prometheus 10skubectl get pods
NAME                                     READY   STATUS    RESTARTS   AGE
prometheus-prometheus-0                  2/2     Running   5          10s
A prometheus-operated service should also have been created:
kubectl get services
NAME                  TYPE        CLUSTER-IP   EXTERNAL-IP   PORT(S)    AGE
prometheus-operated   ClusterIP   None         <none>        9090/TCP   17s
Access the server by forwarding a local port to the service:
kubectl port-forward svc/prometheus-operated 9090:9090
ServiceMonitor
The operator uses ServiceMonitors to define a set of targets to be monitored by Prometheus. It uses label selectors to define which Services to monitor, the namespaces to look for, and the port on which the metrics are exposed.
Create a file service-monitor.yaml with the following content to add a ServiceMonitor so that the Prometheus server scrapes only its own metrics endpoints:
apiVersion: monitoring.coreos.com/v1
kind: ServiceMonitor
metadata:
name: prometheus
labels:
name: prometheus
spec:
selector:
matchLabels:
operated-prometheus: "true"
namespaceSelector:
any: true
endpoints:
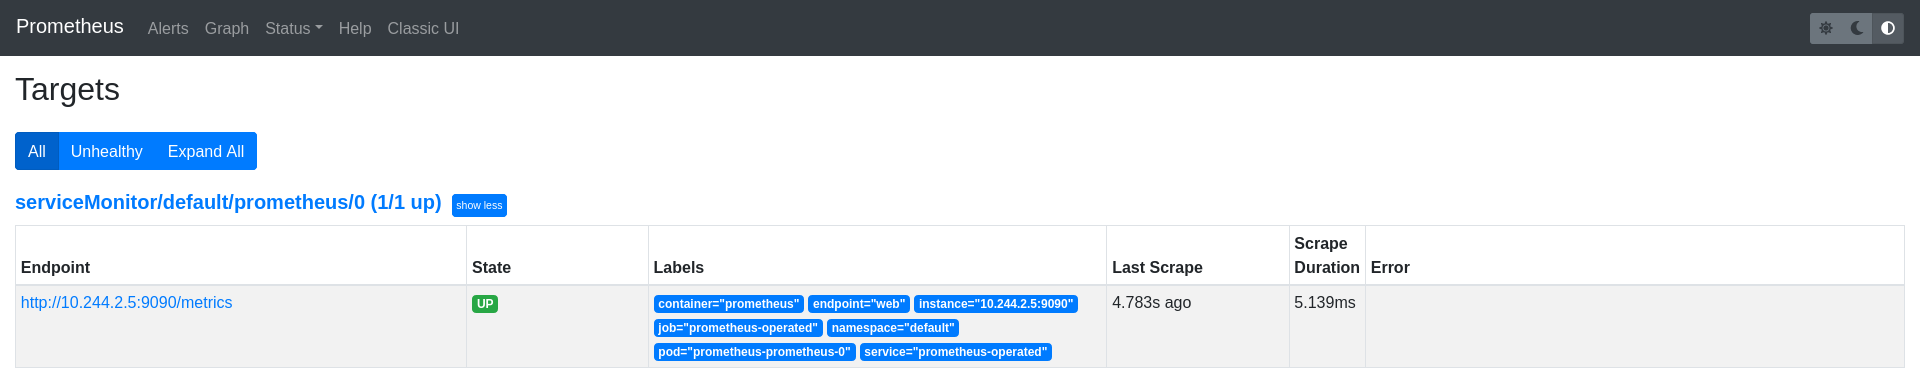
- port: webThe ServiceMonitor only matches services containing the operated-prometheus: "true" label which is added automatically to all the Prometheus instances and scrapes the port named web on all the underlying endpoints. As the namespaceSelector is set to any:true all the services in any namespace matching the selected labels are included.
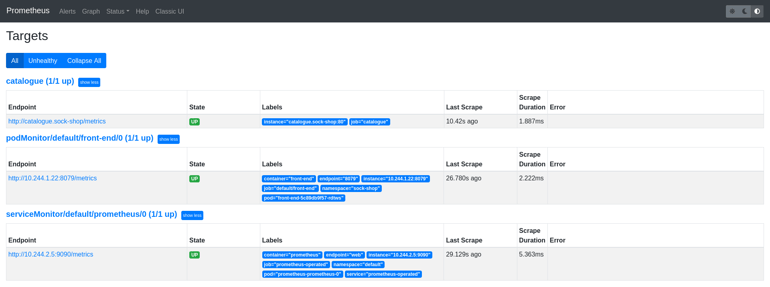
After applying the manifest, the Prometheus endpoints that were picked up as scrape targets should be shown on the Prometheus UI targets page:
PodMonitor
There could be use cases that require scraping Pods directly, without direct association with services (for instance scraping sidecars). The operator also includes a PodMonitor CR, which is used to declaratively specify groups of pods that should be monitored.
As an example, we’re using the front-end app from the microservices-demo project, which, as we mentioned before, simulates the user-facing part of an e-commerce website that exposes a /metrics endpoint.
Define a PodMonitor in a manifest file podmonitor.yaml to select only this deployment pod from the sock-shop namespace. Even though it could be selected using a ServiceMonitor, we’ve used a targetPort field instead. This is because the pod exposes metrics on port 8079 and doesn’t include a port name:
apiVersion: monitoring.coreos.com/v1
kind: PodMonitor
metadata:
name: front-end
labels:
name: front-end
spec:
namespaceSelector:
matchNames:
- sock-shop
selector:
matchLabels:
name: front-end
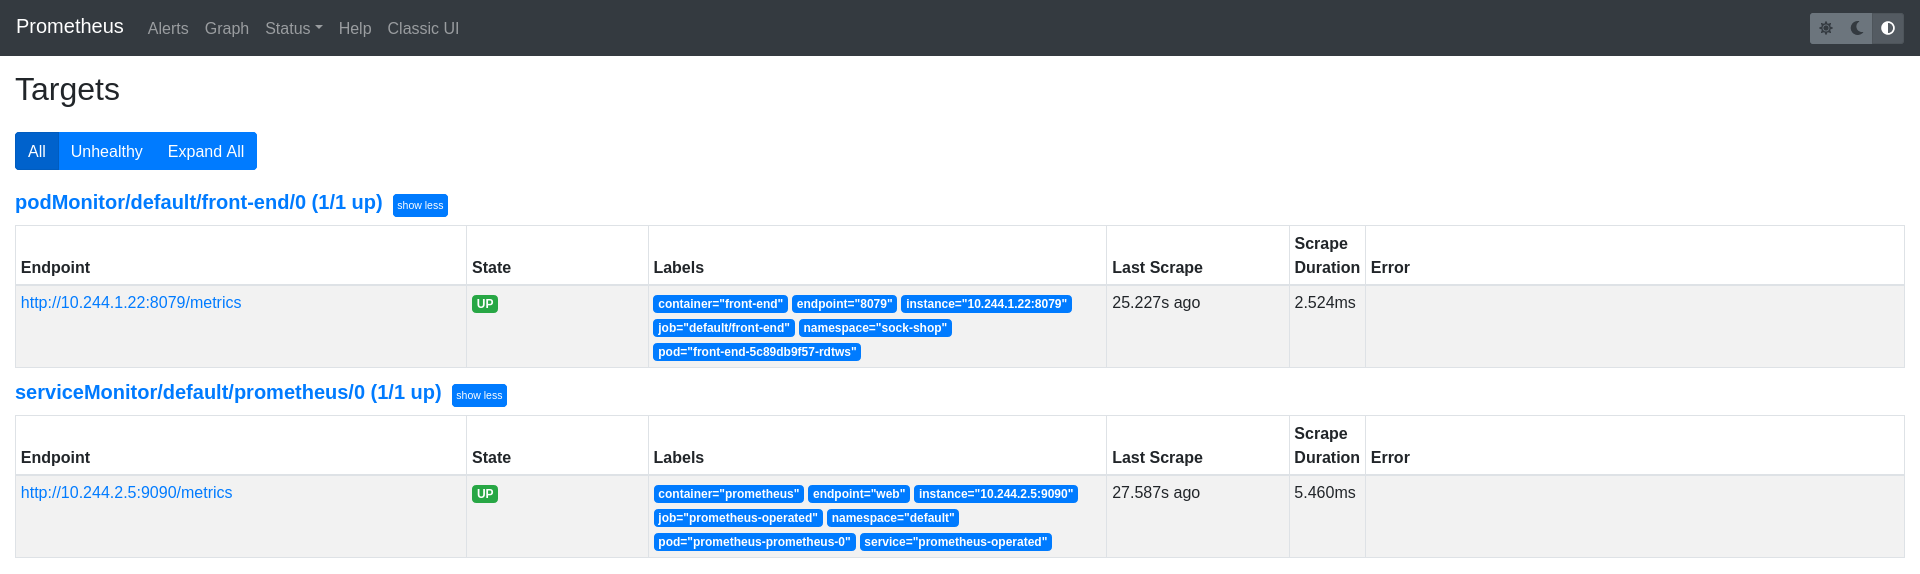
podMetricsEndpoints:
- targetPort: 8079The front-end endpoint should have been added as a Prometheus target:
Additional Scrape Configuration
It’s possible to append additional scrape configurations to the Prometheus instance via secret files. These files must follow the Prometheus configuration scheme and the user is responsible to make sure that they are valid.
An example of which you can see below, where an additional job is added to Prometheus to scrape the catalogue service endpoints. First generate the prometheus-additional-job.yaml file that declares the job to scrape the catalogue service:
\- job\_name: "catalogue"
  static\_configs:
    - targets: \["catalogue.sock-shop"\]
Then create the additional-scrape-configs.yaml secret file with the prometheus-additional-job.yaml content:
kubectl create secret generic additional-scrape-configs --from-file=prometheus-additional-job.yaml --dry-run=client -oyaml > additional-scrape-configs.yaml
Check the additional-scrape-configs.yaml content and apply:
apiVersion: v1
data:
  prometheus-additional-job.yaml: LSBqb2JfbmFtZTogImNhdGFsb2d1ZSIKICBzdGF0aWNfY29uZmlnczoKICAgIC0gdGFyZ2V0czogWyJjYXRhbG9ndWUuc29jay1zaG9wIl0K
kind: Secret
metadata:
  creationTimestamp: null
  name: additional-scrape-configs
kubectl apply -f additional-scrape-configs.yaml Finally the Prometheus instance must be edited to reference the additional configuration using the additionalScrapeConfigs field:
apiVersion: monitoring.coreos.com/v1
kind: Prometheus
metadata:
  name: prometheus
spec:
  serviceAccountName: prometheus
  serviceMonitorNamespaceSelector: {}
  serviceMonitorSelector: {}
  podMonitorSelector: {}
  additionalScrapeConfigs:
    name: additional-scrape-configs
    key: prometheus-additional-job.yaml
  resources:
    requests:
      memory: 400Mi
  enableAdminAPI: false
kubectl apply -f prometheus.yamlNow the catalogue endpoint should also be listed as a Prometheus target:
Alertmanager
The Prometheus Operator also introduces an Alertmanager resource, which allows users to declaratively describe an Alertmanager cluster. It also adds an AlertmanagerConfig CR, which allows users to declaratively describe Alertmanager configurations.
First, create an alertmanager-config.yaml file to define an AlertmanagerConfig resource that sends notifications to a non-existent wechat receiver and its corresponding Secret file:
apiVersion: monitoring.coreos.com/v1alpha1
kind: AlertmanagerConfig
metadata:
  name: config-alertmanager
  labels:
    alertmanagerConfig: socks-shop
spec:
  route:
    groupBy: ['job']
    groupWait: 30s
    groupInterval: 5m
    repeatInterval: 12h
    receiver: 'wechat-socks-shop'
  receivers:
  - name: 'wechat-socks-shop'
    wechatConfigs:
    - apiURL: 'http://wechatserver:8080/'
      corpID: 'wechat-corpid'
      apiSecret:
        name: 'wechat-config'
        key: 'apiSecret'
---
apiVersion: v1
kind: Secret
type: Opaque
metadata:
  name: wechat-config
data:
  apiSecret: cGFzc3dvcmQK
Apply the above manifest:
kubectl apply -f alertmanager-config.yamlThen create the alertmanager.yaml file to define the Alertmanager cluster:
apiVersion: monitoring.coreos.com/v1
kind: Alertmanager
metadata:
  name: socks-shop
spec:
  replicas: 1
  alertmanagerConfigSelector:
    matchLabels:
      alertmanagerConfig: example
The alertmanagerConfigSelector field is used to select the correct AlertmanagerConfig.
Apply and check that it was created:
kubectl apply -f alertmanager.yamlalertmanager.monitoring.coreos.com/socks-shop createdAn alertmanager-operated service should have been created automatically, use it to access the Alertmanager web UI:
kubectl port-forward svc/alertmanager-operated 9093:9093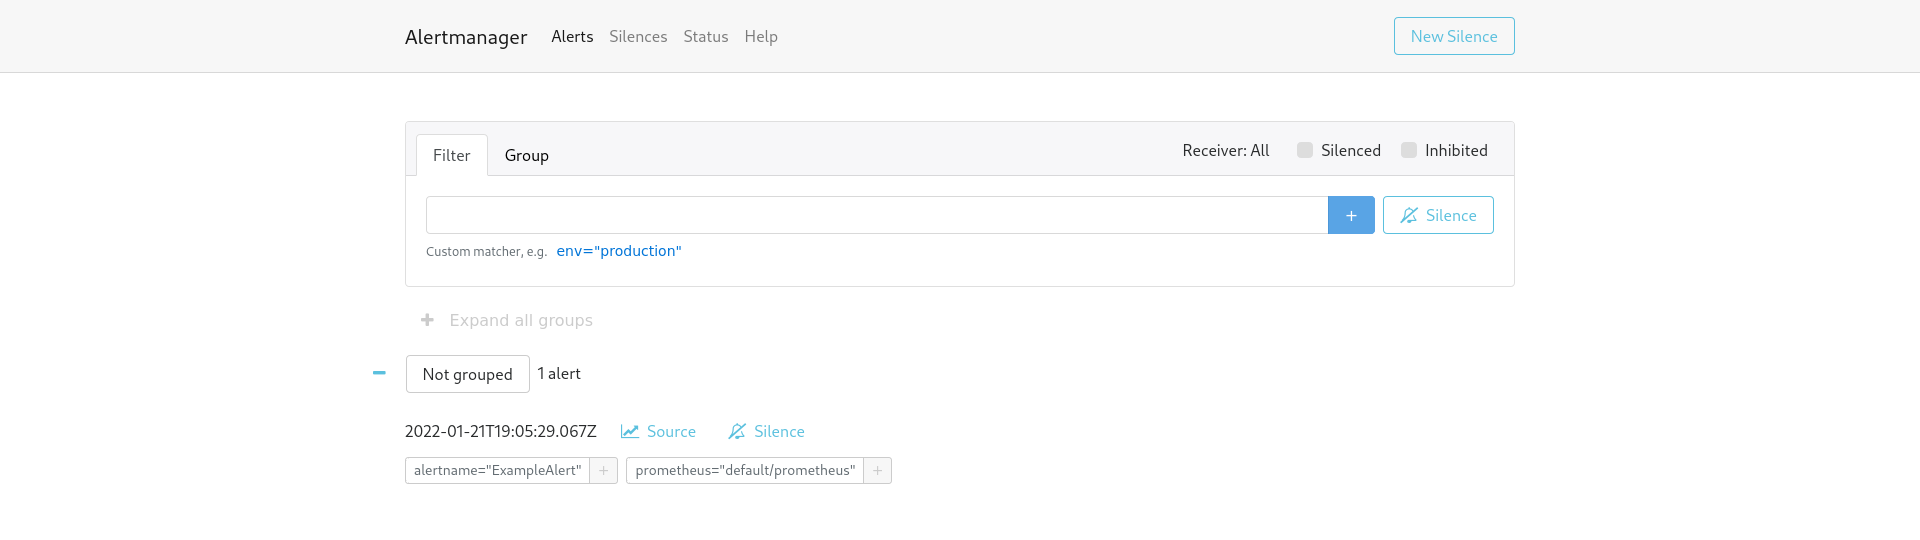
Now we have a fully functional Alertmanager cluster, but without any alerts fired against it. Alert rules can be added using the PrometheusRule custom resource to define the rules that are evaluated.
PrometheusRules
The PrometheusRule CR supports defining one or more RuleGroups. These groups consist of a set of rule objects that can represent either of the two types of rules supported by Prometheus, recording or alerting.
As an example, create the prometheus-rule.yaml file with the following PrometheusRule that will always trigger an alert:
apiVersion: monitoring.coreos.com/v1
kind: PrometheusRule
metadata:
  creationTimestamp: null
  labels:
    prometheus: socks-shop
    role: alert-rules
  name: prometheus-example-rules
spec:
  groups:
  - name: ./example.rules
    rules:
    - alert: ExampleAlert
      expr: vector(1)
Now that the Alertmanager cluster is running and an alert rule was created, we need to connect it to Prometheus. To do this, edit the Prometheus instance to specify the Alertmanager cluster to use and the alert rules to be mounted into it:
apiVersion: monitoring.coreos.com/v1
kind: Prometheus
metadata:
  name: prometheus
spec:
  serviceAccountName: prometheus
  serviceMonitorNamespaceSelector: {}
  serviceMonitorSelector: {}
  podMonitorSelector: {}
  additionalScrapeConfigs:
    name: additional-scrape-configs
    key: prometheus-additional-job.yaml
  resources:
    requests:
      memory: 400Mi
  enableAdminAPI: false
  alerting:
    alertmanagers:
    - namespace: default
      name: alertmanager-operated
      port: web
  ruleSelector:
    matchLabels:
      role: alert-rules
      prometheus: socks-shop
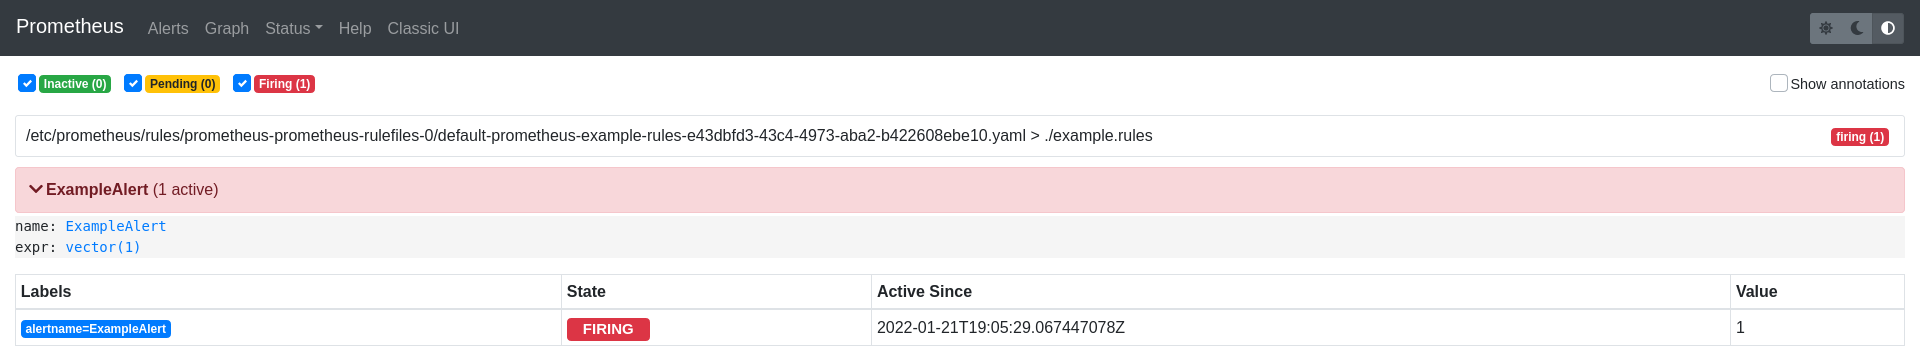
We should be able to see the alert firing in the Alertmanager UI and also in the Prometheus instance alerts section:
Final thoughts
As we mentioned at the beginning of this post, and saw in the earlier examples, using the Prometheus Operator can help to reduce the overhead of managing the components of Prometheus and Alertmanager in a fast, automated, and reliable way.
Despite all the advantages an operator provides, we have to remember that we are adding another layer of abstraction. With this comes a small increase in complexity, which can lead to unnoticed misconfigurations that could be harder to debug than a traditional static configuration.
A final thought, although the operator may be seen as introducing an extra layer of complexity, it is our opinion that this is a justified trade-off, and that the benefits far outweigh any potential downsides.