
Debugging Docker containers can be a very challenging process. Here, I’ll share a few basic techniques for debugging containers—mostly Docker ones, but the techniques are also valid for many other types of Linux container engines. (The methods I’ll detail here are intended for Linux-based systems.)

The inspiration for writing this blog post came from some recent problems the development team of externalsecret-operator experienced during implementation of 1password backend, the library that provides mechanisms to communicate with the 1password API.
To give a little bit of context: externalsecret-operator is an awesome Kubernetes operator that makes secret management less challenging, and helps you to inject secret from third-party credential stores directly into your Kubernetes cluster. (if you haven’t heard about it, it is definitely worth trying it out. Our team is working hard on its development, and new features are added every week.)
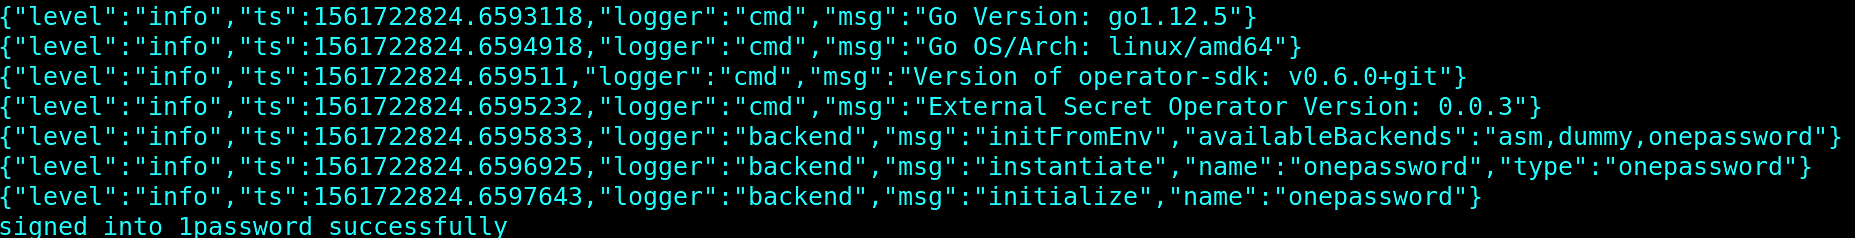
But back to debugging. In the following situation, if we run operator on the host, everything works as expected, and it is able to log into 1password backend:
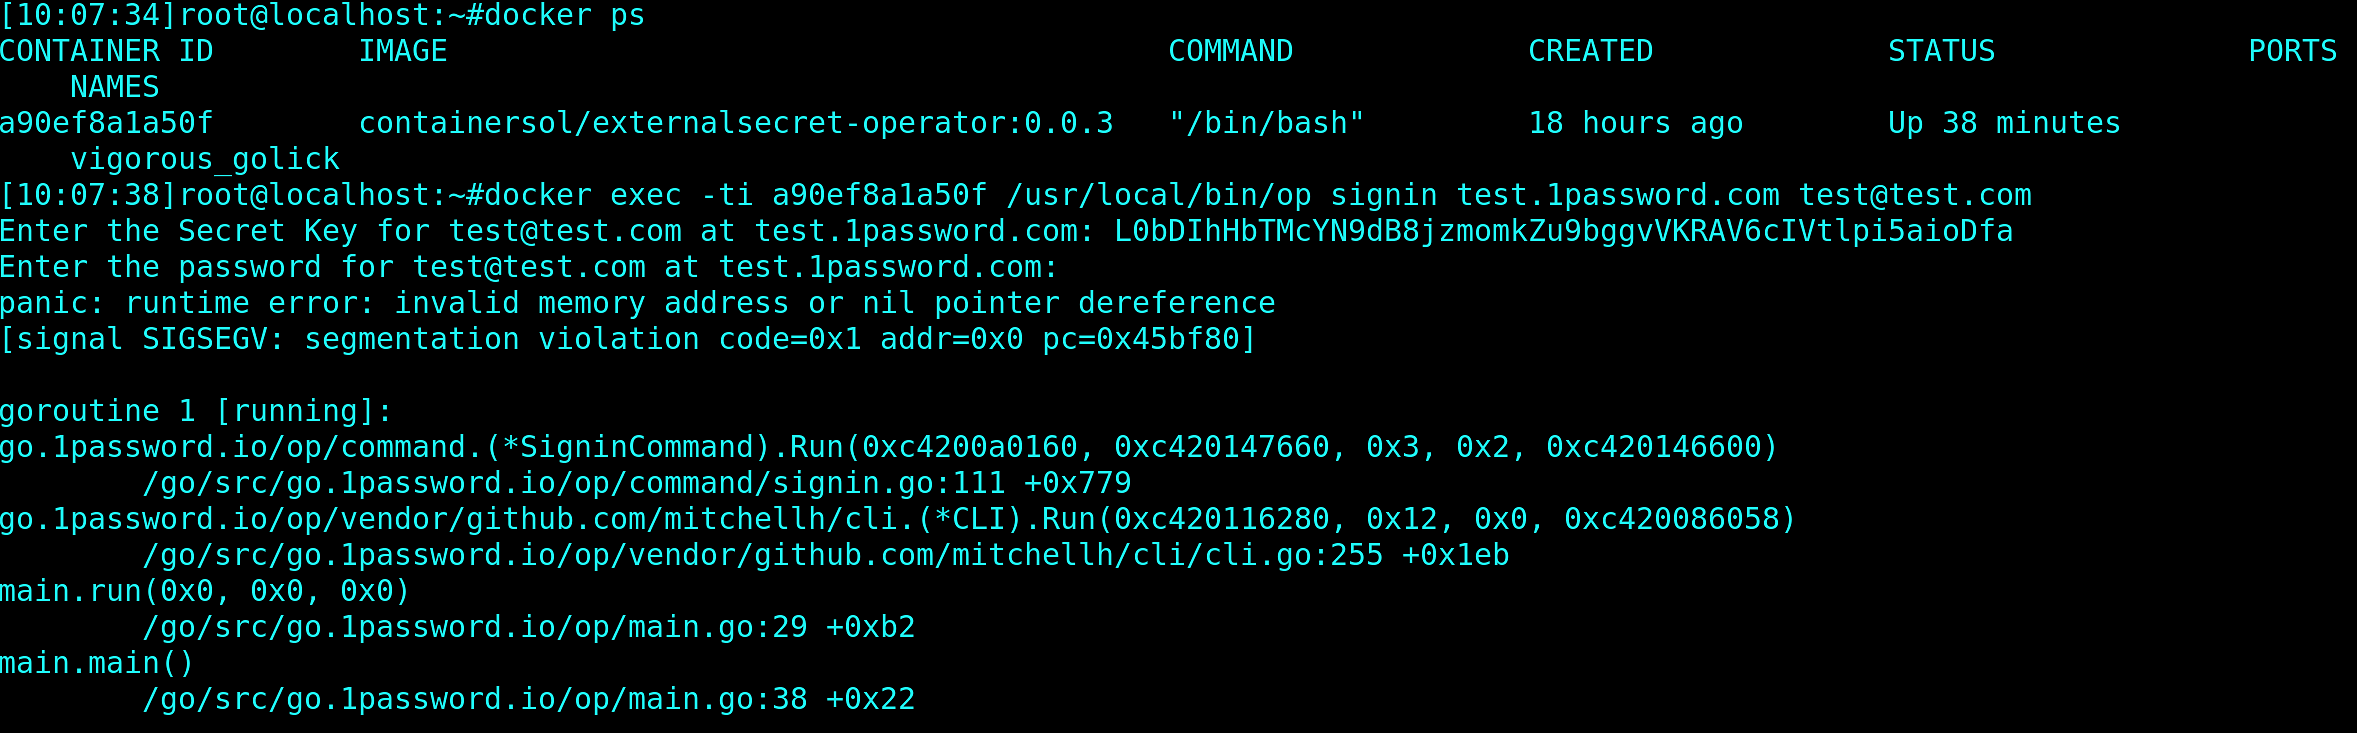
But when run in the container, we see the following error message:
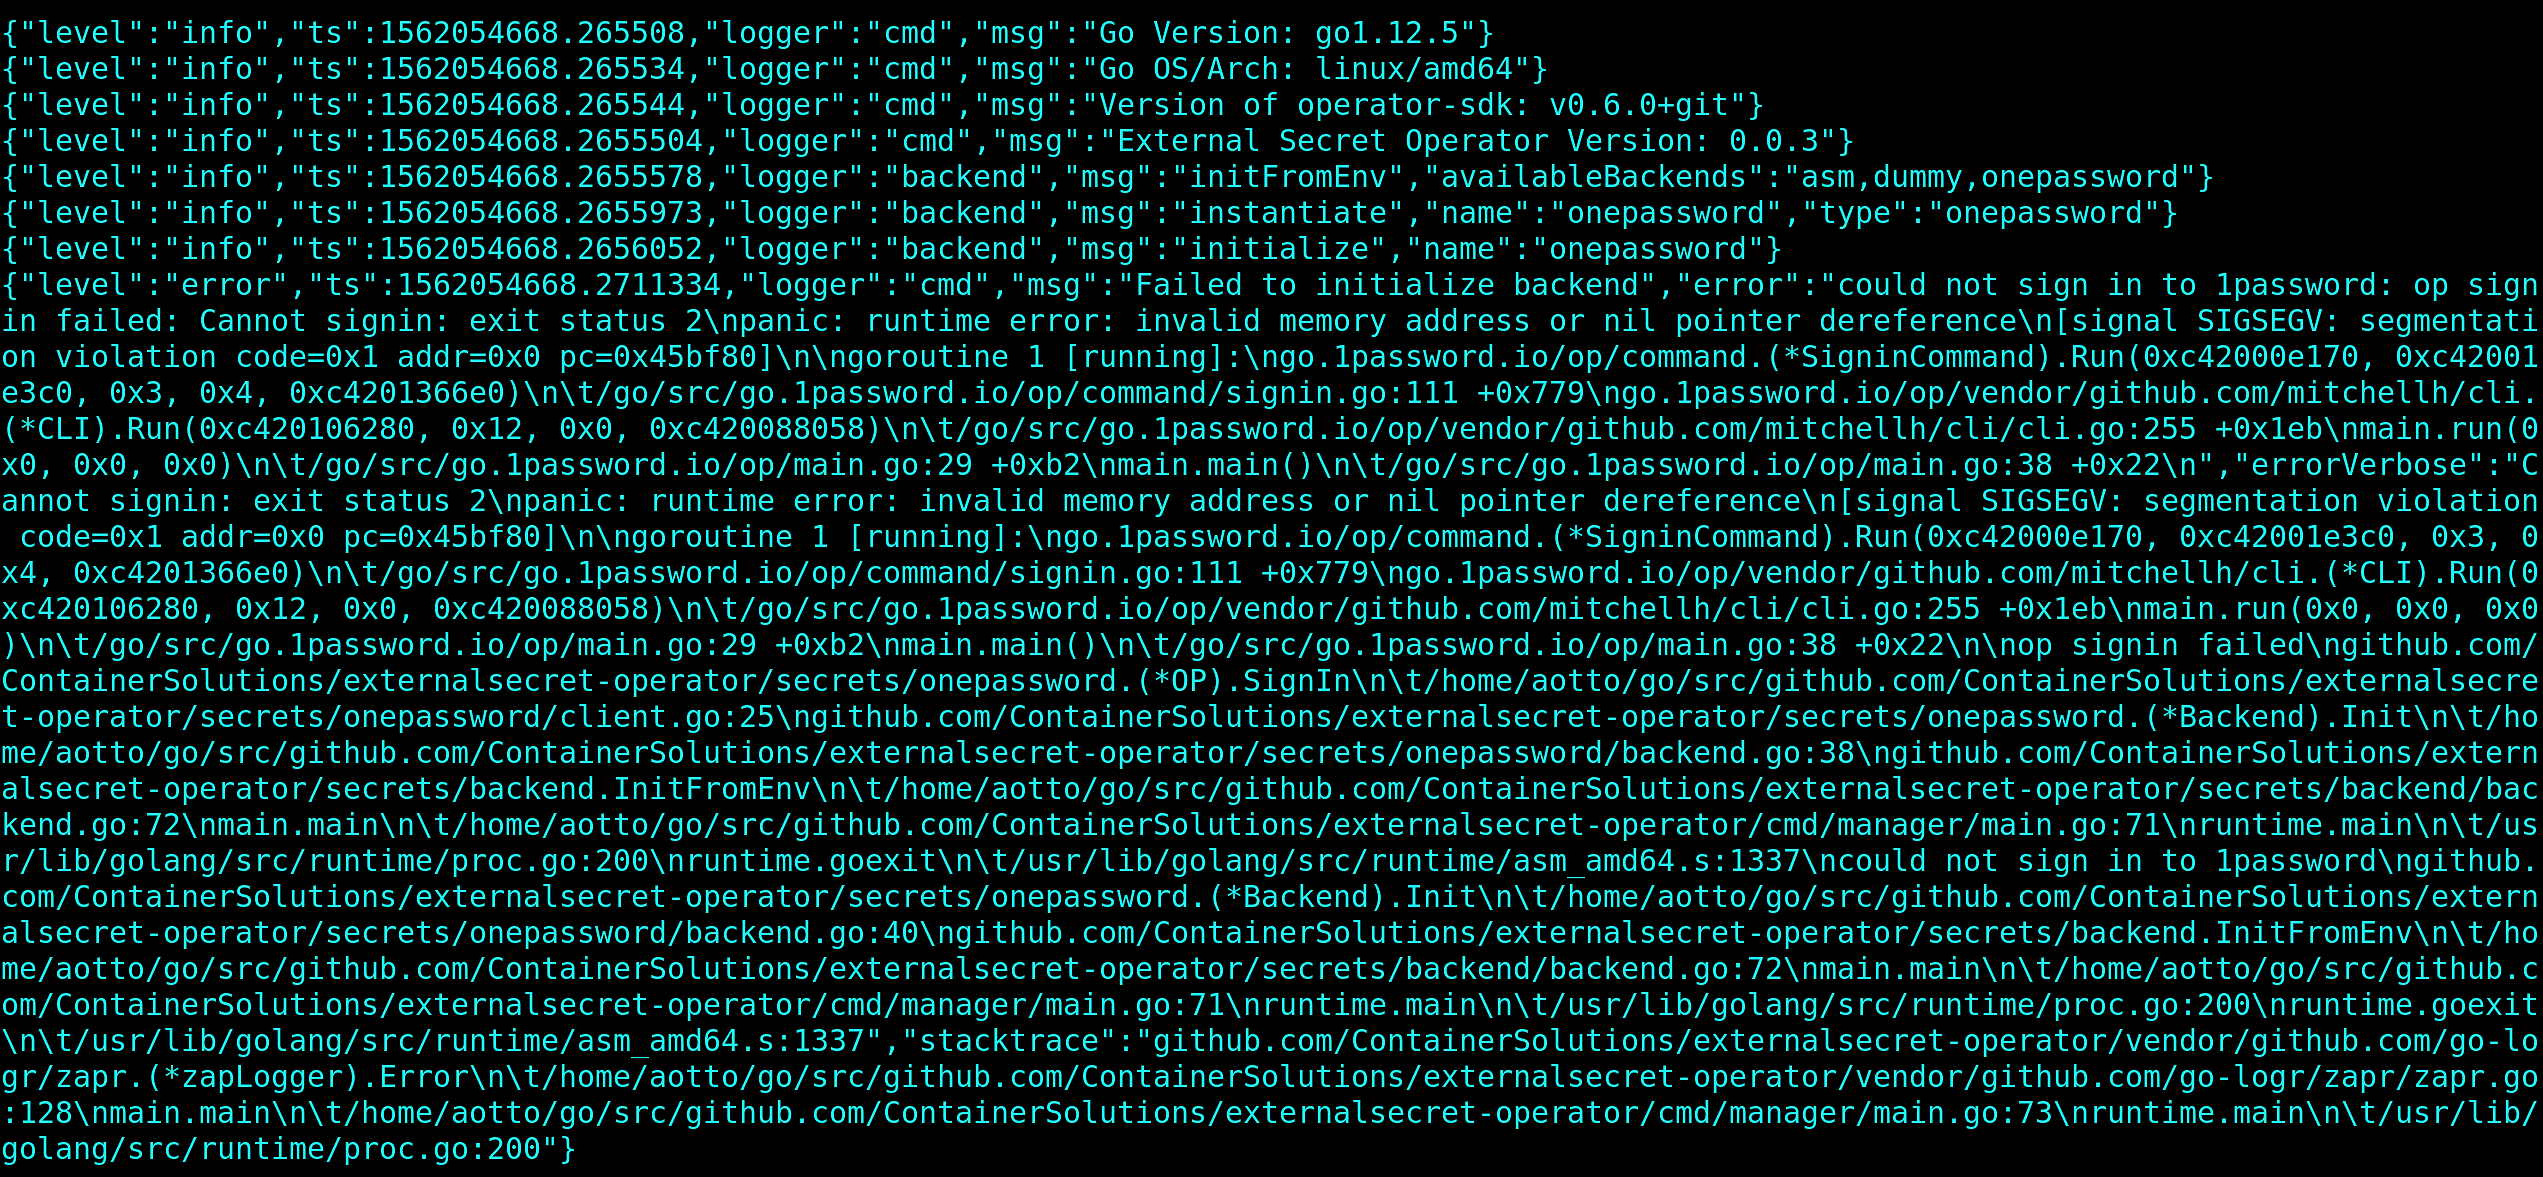
It doesn’t look good. The operator panicked for no obvious reason, but how and where should we start debugging?
Getting Started With a Code Analysis
The best place to start is always the source code, and since externalsecret-operator is open source, we can easily see where the problem is. I recommend using the Sourcegraph tool, which works directly from the browser and can do code analysis. An example of using Sourcegraph to identify the problematic part of the code:
This quick code analysis shows we are lucky and unlucky at the same time: lucky, because our code is not the source of our problem. But also unlucky, because 1password client binary (op) is used for fetching credentials directly from the 1password secret store—both of which unfortunately are not open sourced.
This is where the real fun begins.
The clue to debugging those kind of things that work on the host system but not in the container is to understand what containers are. The containers are a mechanism to isolate processes from each other while running on the same host, which means that any container can be accessed directly from the host system by its administrator.
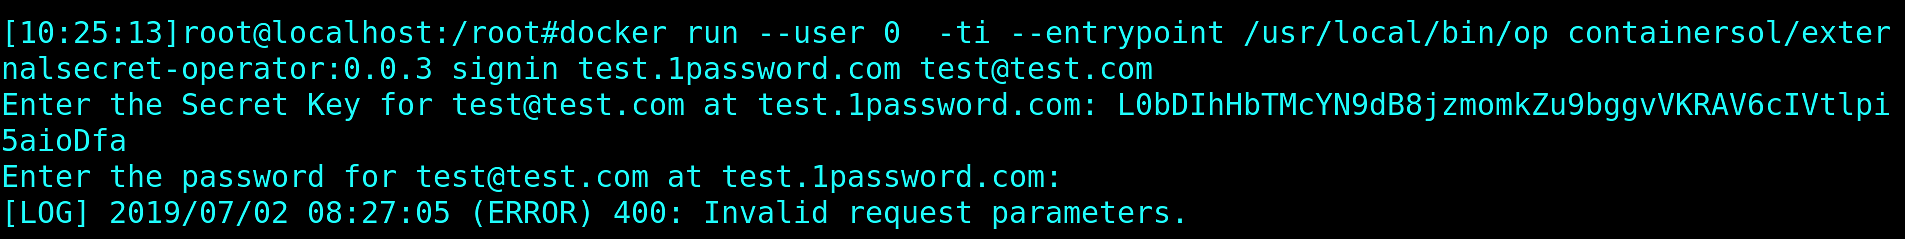
With this knowledge, let’s see if the 1password binary is broken. Firstly, we have to validate if our theory of 1password binary not working in the container is valid. Let’s use it manually, with fake login data:
Bingo! Our theory is confirmed. The 1password binary is not working with the container; it’s panicking instead of gracefully exiting. Now that we have this information, we should confirm whether the problems are with the binary itself or with the container environment. The best way would be to re-use the exactly same binary as in the container image. Let’s do that!
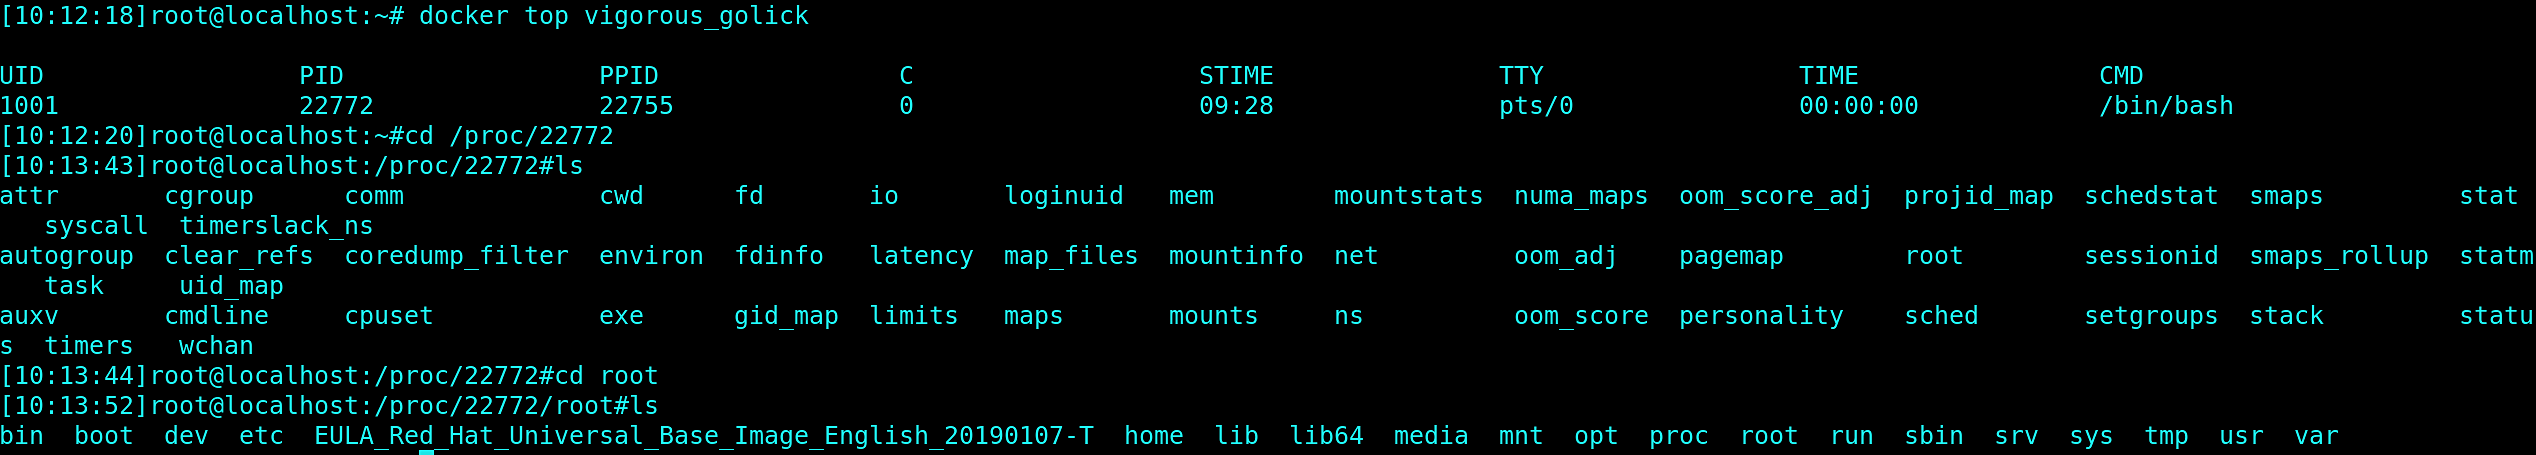
Assuming we have root access to the host running containers, let's see what is the PID (process identifier) of the problematic container on the host, by using docker top <container id> :

We determined the container PID, so now we can find this process in the Linux system process table. Once we are in the process directory, we should look at the root folder, because it is the one which contains the filesystem of the running container:
Checking On the Operator
We can access all binaries in the container and execute them in the host namespace.
So let’s see whether the problems with the operator come from using a wrongful 1password binary:
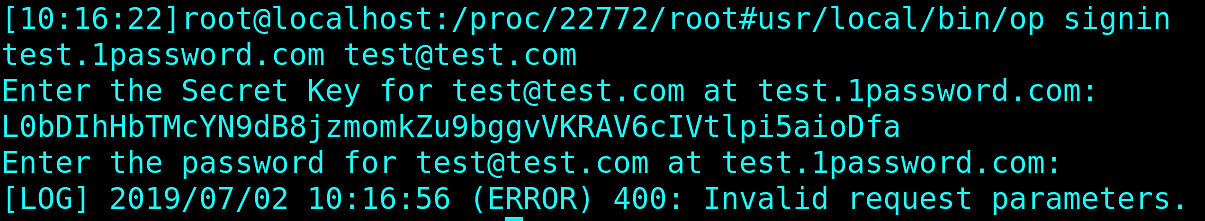
The 1password op binary behaved correctly: since we provided fake data, it couldn’t sign into 1password domain, but it didn’t end up with the panic message. So, the problem is not within the 1password binary.
We can see that the execution error message in the host namespace mentions something about invalid requests. We could suspect there are problems with the networking in the container and the op binary panics if it cannot reach some external services—another theory to test.
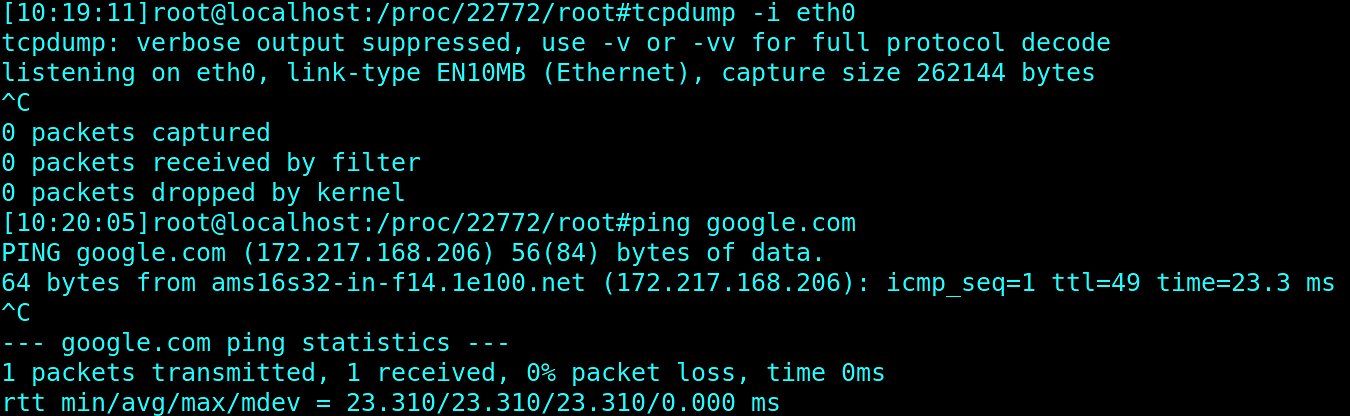
As mentioned earlier, 1password binary is not open sourced, so we are unable to know where it tries to connect. We could try to catch traffic with a network sniffer like Wireshark or tcpdump. But…

… the container image does not include any of those binaries. We could probably install those in the Docker image. But since we have root access to the host, there is an easier way to do it by using nsenter.
The nsenter tool allows us to enter a specific process namespace—so we can, for example, enter the network namespace of the container and still keep access to our host tooling. Let's see that in action:
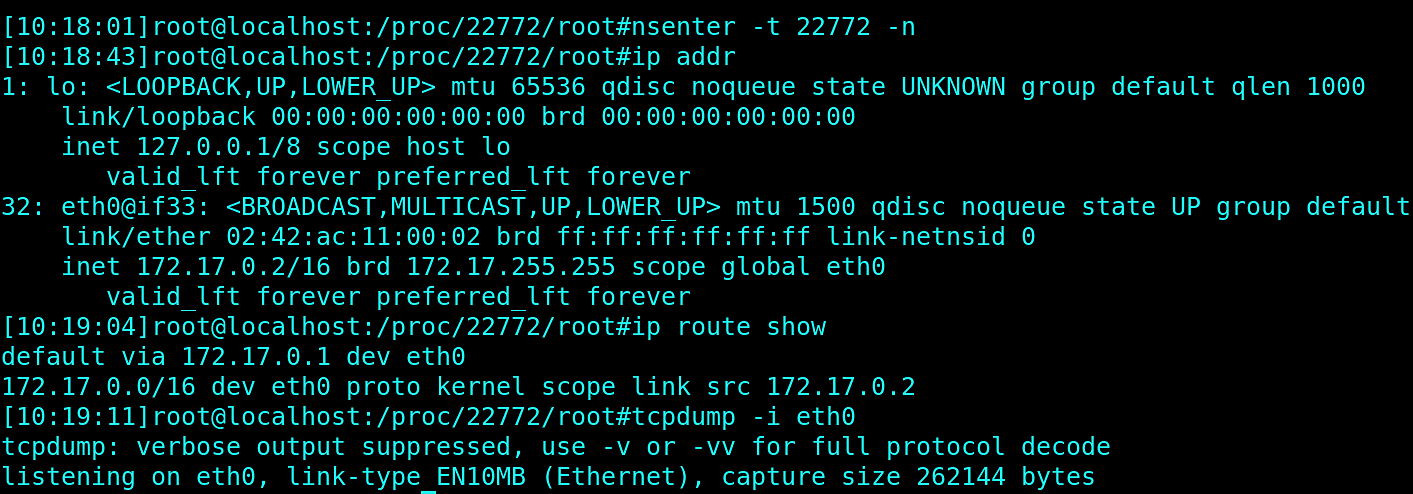
We are in the container network namespace and we have access to all tools from our host system.
In the other shell, we can sign into 1password again using op binary in the container. But no packets were generated, even though it’s connected to the internet:
Zeroing In on the 1Password Binary
So at this point, we can assume that the op binary panics even before the connection to the external service is established.
Now, we could try to debug the op binary with GDB (GNU Project Debugger) to see at what point in the execution it is failing. But it’s likely that 1password does not include debugging symbols, so GBD won’t be able to give us any information about execution. Let’s confirm it, by checking if debugging symbols are present in the op binary:

As assumed, op binary has no debug symbols at all. If it had those symbols, then a number of lines would show numbers other than zero, as in the operator case. There’s no point in using GDB.
In addition, GDB does not support cross-namespaces debugging, so it would not be possible to debug it from the host namespace. We would have to install GDB inside of the Docker images or compile GDB from the source code.
We can’t use GDB, but we can ‘strace’, or trace system calls and signals on, the process: see what system calls are invoked by the op binary during execution. In order to do that, let’s run another container of the same image, but with a modified entrypoint pointing directly to the op binary, with the arguments used earlier:

In the other shell window, we attach to the PID of that container and enter the password:
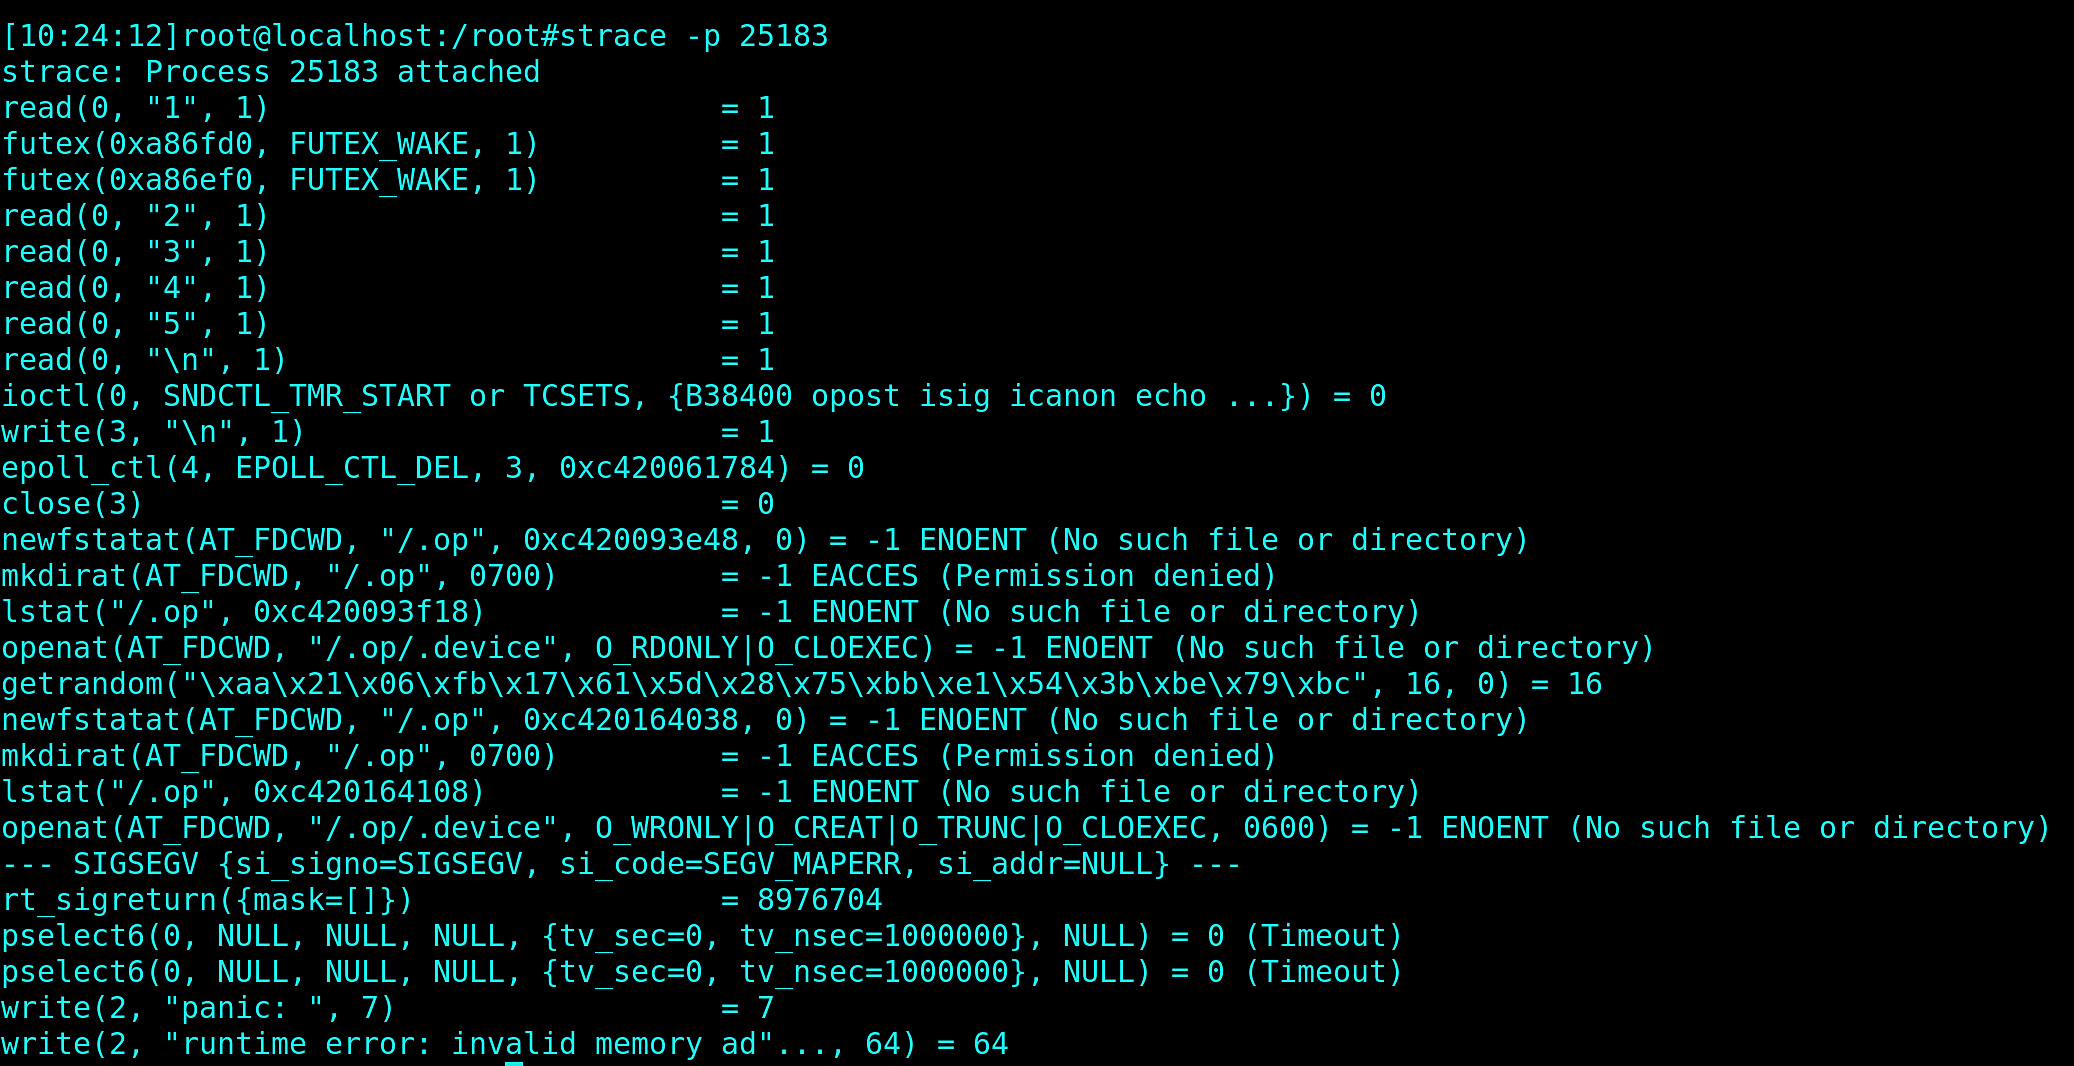
And we see there are some serious problems with it. The binary tries to create .op directory in the root / of filesystem where only super user is allowed:
mkdirat(AT_FDCWD, "/.op", 0700) = -1 EACCES (Permission denied)
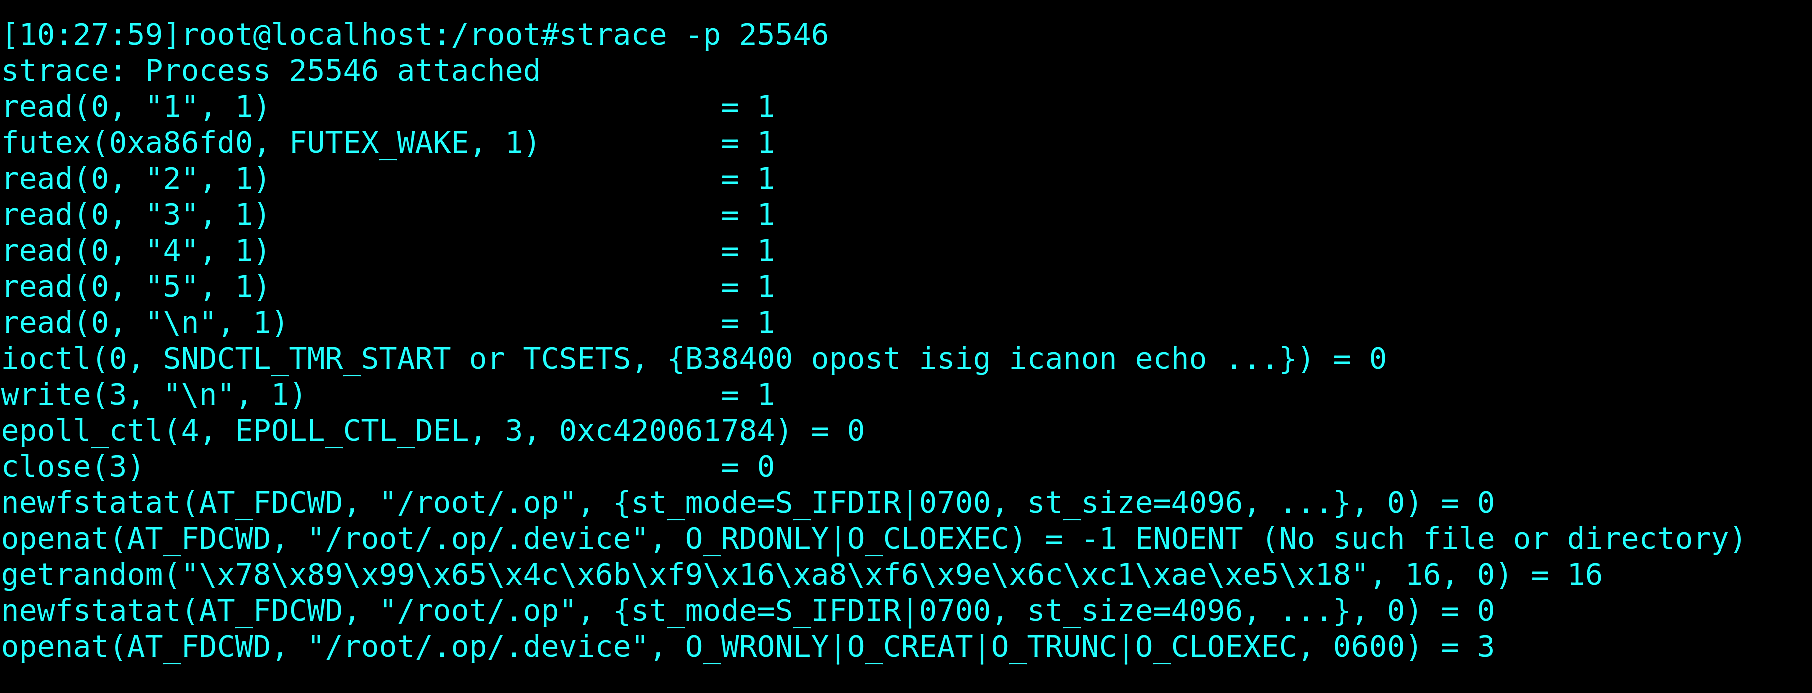
Let’s check what will happen if we run this container as a root user:
Binary didn’t panic and strace showed that op is actually trying to create .op binary in the super user home directory and not in the / :
That points us to the conclusion that a default user may be misconfigured in the Docker images. Let’s check it:
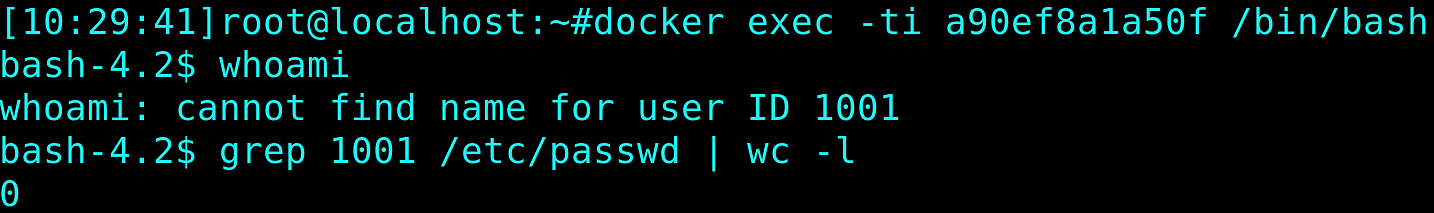
Bingo! The default user is missing from /etc/passwd and is not recognized by system, so op binary cannot determine its home directory and tries to create a directory in the current working directory. This isn’t allowed. So, it panics.
We should never forget that Docker containers are just processes and most of the Linux standard debugging tools can be used on them and eliminate guess-driven debugging.
Once again, I would like to emphasize, that these techniques apply mostly to Linux systems. But for those of you who are running containers on Mac, I would suggest you investigate other techniques, such as running sidecar containers with all the debugging tooling. No matter what system you use, good luck with your debugging detective work!
Are you into solving tech problems? Come join us and Microsoft at the “Distributed Cloud Native Hackathon” in Amsterdam, Warsaw, and Montreal. Participate in games and workshops and get hands-on experience building solutions using Open Source Cloud Native tools!
Sign up here:
