

With this blog post I want to show you why eBPF is a big deal and why it piqued my interest some time ago. I won't go into details on how eBPF works here, but rather highlight the reasons why there is some hype building around it. In future blog posts I plan to go deeper into the technology and its tools.
Before you jump in ...
I would like to give you a basic explanation of what eBPF is before I give you reasons to get excited about it. If you already have a broad understanding of eBPF, you can skip this section and go to the next one.
The idea behind eBPF is that we have a virtual machine running inside the Linux kernel and we can send code for it to execute. For some reason, calling it a virtual machine makes it difficult for me to visualise it, and because of that I started calling it a programmable pseudodevice in my notes (probably because of my electronic engineering background).
Imagine a device that has ‘sensors’, registers, memory, etc. It is programmable, so you can send code that will instruct it on what to do, like what to probe and what to report. However, this device is virtual and running inside the kernel. That's basically it!
The code that we send from user space to kernel space is safely executed in eBPF because it has a verifier that guarantees the following conditions before it compiles/runs:
- the program does not loop
- there are no unreachable instructions
- every register and stack state is valid
- registers with uninitialised content are not read
- and the program only accesses structures appropriate for its BPF program type.
So this very simple virtual machine is attached to some specific hooks inside the kernel. The amount of hooks for eBPF are increasing everyday because of its capabilities. There are a lot of possible use cases for eBPF, but let’s focus on observability to simplify the explanation. Here’s an example of BBF flow, from the blog of Brendan Gregg, a Netflix senior performance architect.
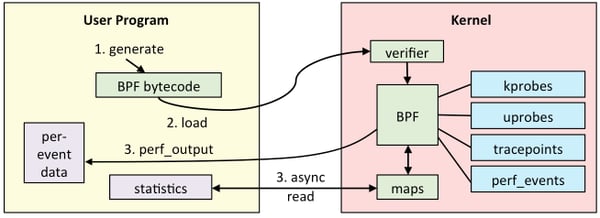
If the BPF code that you write is accepted, it can get attached to some event sources like the ones in the image above:
- kprobes: kernel dynamic tracing.
- uprobes: user level dynamic tracing.
- tracepoints: kernel static tracing.
- perf_events: timed sampling and PMCs.
After measuring any data from these event sources, the program can then return this data to user space for it to be shown, or processed. And that's eBPF in a nutshell!
Now that you have a general understanding of what eBPF is, let's get back to why you should give it a chance.

Reason No. 1: Sometimes, Only eBPF Gets the Job Done
While this may seem an exaggeration, eBPF can be the best solution to diagnose and solve multiple problems, because of either specificity or performance overhead.
It offers very specific tracing functionality.
This anecdote is about what caught my attention regarding eBPF way back when. It all started with the following tweet by Software Engineer Julia Evans, though it was quite some time before I got back to eBPF and looked deeper into it.
She was looking for a command-line tool with a very specific functionality: Something that could show connection lengths on a given port. The initial reasoning was to easily and quickly check if HTTP requests were actually slow there. In this same thread of tweets, we can see Brendan Gregg suggesting some perf-tools alternatives to get this information.
But the really exciting thing was Brendan Gregg's post about the launch of tcplife into BCC collection later that year. I remember seeing this post and deciding that someday I would take the time to learn eBPF properly because of the doors that it seemed to open.
This is an example output of tcplife:
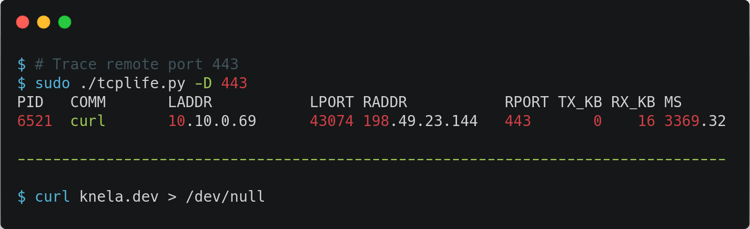
I would like to point out some exciting things about this. Tcplife shows some interesting data, like process ID and process name; you know, info that you won’t get out of a tcpdump output, for example. To avoid performance overhead, this tool does not track packets—it just instruments events that change the TCP state, getting timestamps out. And of course, the functionality that Evans asked for is present, and you can simply check connection lengths in the last column!
Like Brendan Gregg says in some of his talks, building things around eBPF is like having hidden superpowers. You just need to ask the right questions to make something interesting come out of it.
eBPF provides tracing without breaking production.
When I was learning more about Linux, and more specifically about Linux user space debugging, strace was a very exciting command to throw everywhere to understand what system calls are being fired.

What people forget to tell you (or maybe they tell you and you just forget about it) is that strace creates huge overhead on the system. Brendan Gregg actually writes about it in his blog post strace Wow Much Syscall. Running strace to understand something that is happening in a production environment with high load could be catastrophic, and could just throw your server to the ground. Of course, it might be OK to do it if you have redundancy or if your server is down anyway, but that is not always the case.
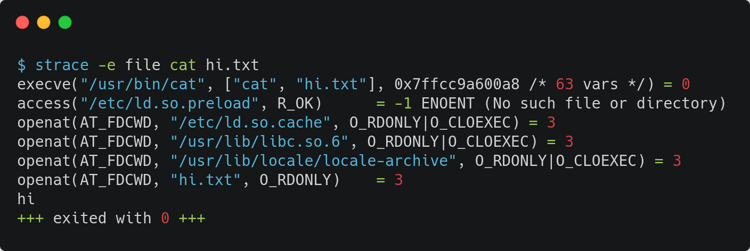
In his post, Brendan Gregg suggests some other tools at the end, listing perf_events, Sysdig, Ktap, SystemTap and, in a later edit to the post, perf_trace. But this post is from 2014, before eBPF was merged to the kernel. perf_trace is a completely fine tool to avoid overhead and do tracing, but there is a trace tool in BCC that I find more exciting because of the eBPF ecosystem (more on that on a later section of this post). Let's check an example of similar usage of strace and BCC's trace.py. The first screen capture here shows using strace for a simple cat command; the second shows using BCC's trace.py for a simple cat command.
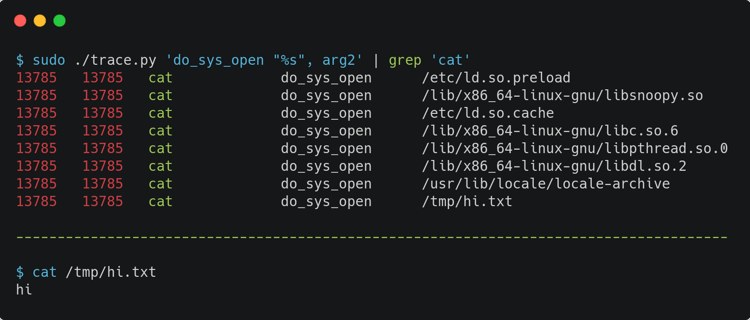
Using trace.py from BCC adds a bit of complexity because your kernel has to be recent, you need to have BCC tools installed, and you need to understand its cli arguments. But it will be way more performant and generate less overhead. Besides, it is more flexible and powerful, considering what to probe while also considering filters, buffer pagers, and other configurations for tracing.
Reason No. 2: Big Players Are Adopting eBPF
It is certainly a reason to keep an eye on eBPF right now. Cilium was probably the first team to build a whole product around it, actually for both network observability and control, but many observability players have been going in that direction lately.
In 2017, Brendan Gregg gave a lot of talks about eBPF, and as we saw in his earlier quote, he said that eBPF was at a stage in which it had a lot of hidden superpowers, and that we need to ask the right questions to draw great functionalities from it. But in 2020, I think it is safe to say that, with this many production-ready tools using it, we are gracefully discovering its powers!
I will briefly go over the ones that I find more interesting, but hope to further explain all of them in my next blog post.
Cilium and Hubble
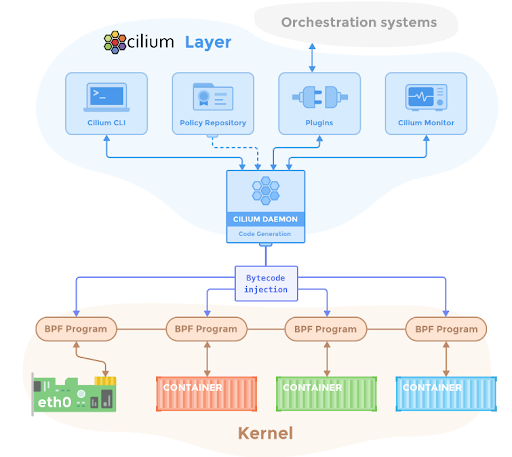
Cilium is a somewhat popular Kubernetes cni plugin that is based entirely on eBPF for providing and transparently securing network connectivity and load balancing between application workloads. This diagram in its Github repository gives some insights on how that is achieved.
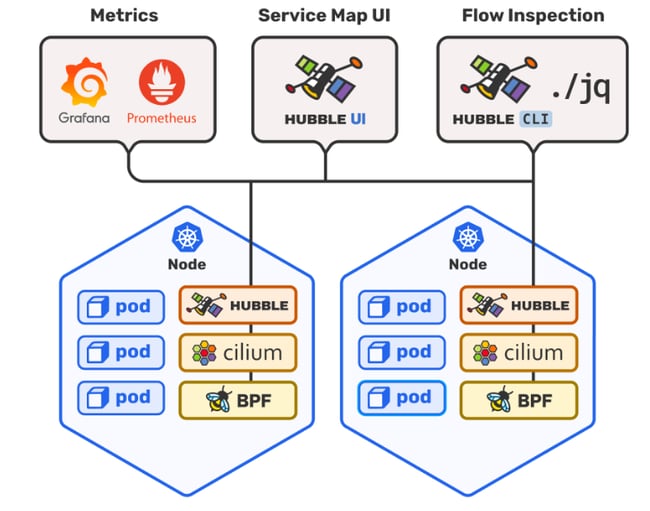
Hubble is Cilium's solution for network observability. It exposes communication maps, security policies being enforced/triggered, and does monitoring/alerting. It also offers a simple diagram to show its architecture in its repository.
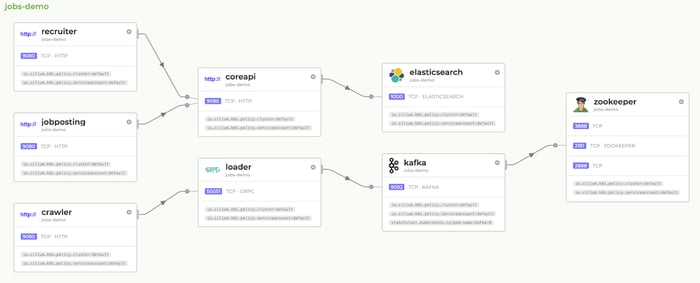
This is an example of Hubble's service map dashboard:
Prometheus eBPF Exporter
Cloud Flare open sourced the first release in 2018 and this exporter is basically BCC tools as Prometheus metrics. So, instead of cli tools that would require you to ssh into a machine to trace something, you would instead write eBPF programs and turn them into Prometheus metrics to check in Grafana graphs.
Readily available examples would be CPU usage, memory usage, or Cgroup CPU usage for checking ‘per service’ metrics in your infrastructure. (The first image that follows is a node_exporter overview; the second is a cAdvisor "per service" visualisation.)
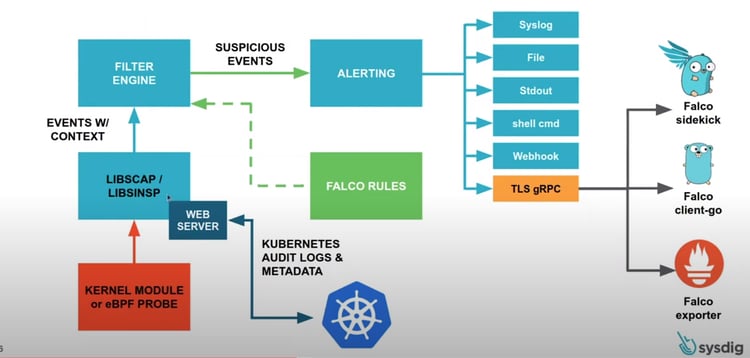
Sysdig's Falco
Falco is a Kubernetes runtime security tool. It aims to detect anomalous activity in nodes and containers. It monitors spawning processes, like if a MongoDB container that should only have the MongoDB process running on it also has a second weird, unexpected process running; or even networking activity, like if Nginx opened an unexpected listening port on a server. Sysdig also provides a handy architecture diagram for us to better understand Falco’s architecture.
Additional Players
The list goes on with:
- Datadog's fork of Weaveworks’ TCP tracer (Datadog Performance Monitoring)
- Flowmill
- Weave Scope
- ntopng
- Inspektor Gadget
- Instana (OS Processes)
There are some other very closed solutions using eBPF internally in companies such as Facebook and Netflix, specially for XDP edge firewalling replacing iptables for a number of reasons. Most of them focus on network observability and control, but some try to instrument other data like Prometheus eBPF Exporter, Falco, and Instana. Leave a comment below letting me know which of them you think would be more interesting to read a future blog post about, or if you are using any of them.
Reason No. 3: Flexibility and Speed in Having New Kernel Tracing Tools
This is probably the most exciting reason for the hype surrounding eBPF, in my opinion. We can argue that eBPF is simply the kernel tracing winner.
As Daniel Borkmann, a software engineer at Isovalent, says in his talk eBPF and Kubernetes: Little Helper Minions for Scaling Microservices, Linus Torvalds, creator of the Linux kernel, has a rule to accept and merge new crazy ideas into the kernel. Every new crazy idea should be wrapped in a gift package that makes it obviously good at first sight. The idea is crazy, but its arguments are reasonable, and far from crazy. This was the case for eBPF, when they were trying to convince Torvalds to merge it.
We have `ftrace` and `perf_events` as examples of tracing tools that got merged to the kernel, but waiting for things to get merged can be annoying and take too long. Having a way to just dynamically send programs to be attached to kernel internals speeds kernel tracing tools development immensely.
Yet another option is to write custom kernel modules for tracing; this is flexible and dynamic enough, but it is not safe because you can crash the kernel. Having eBPF VM designed to safely run programs without freezing or crashing the kernel is then a better option.
Conclusion
In this post, I tried to briefly show you what excites me about eBPF and some of the reasons for the ongoing hype in the observability landscape. I think it is important to show that we already have tools for using this in production and that eBPF is mature enough for it. Like Brendan Gregg says in one of his talks, you don't necessarily need to know everything about eBPF to get excited about it, but it is nice to understand the capabilities that it brings to the table.
And it is totally awesome that we have so many people creating abstractions around it to make it easier to use. I plan to dig deeper into this technology in future blog posts, so leave me your comments below and let me know what you would like to see, and what you are already using in your setup!