For most people the word ‘chaos’ means complete disorder and confusion. So what does it mean to engineer chaos? The distributed systems we build are becoming more and more complex, thus their state cannot be predicted under all circumstances. From this point of view they are chaotic— so we have to test them by introducing the chaos of the real world and see if they survive it.
We would like to share our recent findings using some of the open-source projects that specialise in chaos engineering. Focusing on Kubernetes Native tools means that we are particularly interested in leveraging the benefits that Kubernetes brings.
These benefits revolve around a layer of three main component categories:
- built-in components, such as deployments, pods, and services;
- standardised custom components that consist of custom controllers or APIs that have already been standardised
- bespoke custom components, such as custom controllers and APIs for which there are no standards yet.
Those last two categories in particular are addressed by the Kubernetes operator concept, which is why we will be talking about the existence of a Kubernetes operator for each of the tools we discuss.
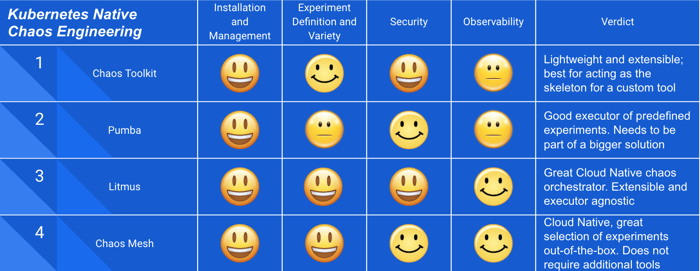
There are dozens of tools available, with different levels of maturity. We’ve chosen four to explore in more detail:
We assessed them in four specific categories: Installation and management, Experiment definition and variety, Security, and Observability. Before we go into more details, let’s first establish some basic principles of chaos engineering and the reasons behind its importance.
What Chaos Engineering Is, and Why It Matters
In software engineering, ‘chaos engineering’ refers to the effort of identifying weaknesses in a system before they manifest themselves to real users. Or, simply put, breaking things intentionally in order to uncover hidden anomalies.

In short, these are the key aspects of chaos engineering experiments, as defined by the chaos engineering community:
- Definition of the steady state
The first important step is to define what is the steady state of the system—how it behaves under normal circumstances. This will serve as the reference of the experiment.
- Formulation of a hypothesis
In this step, we form a hypothesis regarding the expected behavior of the system after we introduce certain failures. Typically, this hypothesis will naturally follow the lines of the steady state, especially since the goal is to uncover unidentified issues.
- Introduction of real-life variables
It is key that we introduce variables that represent real-life events and situations, for example a surge in traffic to an e-commerce website. The closer these variables are to real life, the more likely we will uncover real problems.
- Disprove the hypothesis
The goal here is to evaluate if our hypothesis is disproved, meaning identify if the behaviour of the system is not the one expected or if there is significant deviation. This deviation should be thoroughly observed and reported, as it will serve as the basis to improve the identified issues.
One key difference between any other type of testing and chaos testing is that the goal is to perform chaos experiments in production environments using real production traffic and workloads. Since the intention is to uncover real hidden anomalies, it is paramount that we introduce chaos in the actual live applications.
However, that highlights even more the need of defining controlled, secure, and observable experiments. Not handling properly the blast radius and magnitude of the experiment can achieve the opposite effect: uncontrollable chaos in production systems.
The TL;DR
The above chaos engineering principles serve as our guidelines in assessing the four open-source tools mentioned in the introduction. This section provides our main insights and takeaways from this investigation. Overall, they all performed quite well and the main takeaway is that they all can be useful, depending on the intended use.
Easy administration
All of the tools seem to be strongly Kubernetes native with respect to installation and management. Chaos Toolkit, Litmus and Chaos Mesh use the concept of an operator, while Pumba suggests a DaemonSet.
Reporting is user driven
However, improvements are needed regarding reporting the progress and results of the experiments, with only Litmus providing a specific Custom Resource with the result of the experiment and relevant events. In most cases, the users need to rely on their existing monitoring infrastructure.
Different purpose
Looking at how these tools execute chaos engineering experiments, we found that only Litmus and Chaos Toolkit have the concept of an experiment based on the chaos engineering principles described in the above section. They both provide their own experiment definition, which enables them to act as Chaos Orchestrators.
On the other hand, Pumba and Chaos Mesh focus on execution of experiments, with Pumba providing a simple interface, while Chaos Mesh follows a more Cloud Native approach, by using Custom Resource Definitions for the execution of experiments.
Experiments affect security
The tools all have similar security constraints, as under the hood they use similar capabilities and methods to execute the experiments. If there is one notable difference, it’s that Chaos Toolkit and Litmus give users the option to create more fine-grained experiments. Pumba and Chaos Mesh are more opinionated executors, which makes them less flexible in terms of security.
What is important to mention is that the experiment actions themselves determine the required security constraints of the experiment. For example, network-latency experiments might require more elevated privileges, while killing a pod is a less intrusive action. Therefore, although the tools themselves can be considered secure, the users must ensure that each experiment is well-designed from a security standpoint.
How Each Tool Performs
Chaos Toolkit
Focusing a lot on extensibility, Chaos Toolkit aims to become the framework to create custom chaos tools and experiments. It embraces the full lifecycle of experiments, making it possible to run checks (which are called probes) at the beginning of an experiment to check the state of a target application, followed by actions against the system to cause instability, and verifying if the expected final state is achieved.
Existing packages, called driver extensions, like the AWS Driver or the Kubernetes Driver, can be easily installed to facilitate the use of additional actions against an extended list of target platforms. New custom drivers can be created, or the existing ones can be enhanced, as a way to have more types of probes and actions available for experiments. Furthermore, there is an ongoing Open Chaos Initiative that aims to standardise chaos experiments through the use of the Chaos Toolkit Open API specifications.
Installation and management
Installing Chaos Toolkit is as simple as installing a Python package with pip install. This will install the chaos command-line utility. If you want to use additional driver extensions to enable more specific actions and probes, like interacting with cloud services such as GCP or Azure, you can similarly install the Python package of the desired extensions. There is also a Kubernetes extension providing actions and probes for pods, services, deployments and other resources, but this approach involves using the command line directly to run the experiments pointing to JSON files describing the steps of the experiment.
Alternatively, there is a Kubernetes operator for Chaos Toolkit with Custom Resource Definitions (CRDs) that can be used to create Experiment resources in the cluster, making it possible to use our beloved kubectl to apply YAML manifest files. Based on these created objects and by also using ConfigMaps containing the JSON files entries describing the experiment steps and actions, the Chaos Toolkit Operator will create pods to run the experiments from within the cluster, while internally using the same chaos command line tool.

Experiment definition and variety
The definition of experiments is one of the best features of Chaos Toolkit. It makes use of JSON format to define the experiments in a clear way. It makes use of probes and actions as a way to control the experiment. Probes are used to verify the steady state of resources, like reaching to applications or fetching metrics, while actions are used to change the state of resources or apply some chaotic behavior, either using an API or running a command. It also provides the ability to rollback at the end of the experiment, which helps in reverting the chaos in case of errors or cleaning up resources after the experiment is completed.
An example of an experiment definition is shown in the following code snippet.
|
In the above experiment, Chaos Toolkit initially verifies that there are at least two replicas of the target application running. Upon verifying the steady state, it will kill one of the replicas using the Kubernetes Driver referenced in the field "module":"chaosk8s.pod.actions". Optionally, we can specify a rollback action in case the experiment fails and we need to revert the chaos.
As the tool relies mainly on the presence of drivers, there are not a lot of experiments that can be used out of the box. The user is the one that needs to define their own building blocks for their experiments using the driver extensions, which gives a great amount of freedom. There are already many generic drivers that can be used for different purposes (network, cloud provider specific, observability, probes and exporters among others) but it is almost certain that for a more customised use, one has to further develop new drivers.
Security
Like any other operator running in a cluster, besides the permissions to watch and manage its own CRDs, the Chaos Toolkit operator needs a service account with enough privileges to do its job. For instance, to run a simple experiment to delete an application pod in a given namespace, the operator will create a chaos toolkit pod using a service account with enough permissions to delete pods. Custom chaos toolkit pods can be configured specifying the pod templates in the Experiment custom resource, which might require additional roles or secrets available.
Any specific network access or more elevated privileges may be required depending on which additional drivers will be used. This modular approach makes it easier to keep things secure, as one can pick or develop drivers that match their own requirements.
Observability
As with most of the Cloud Native tools nowadays, Chaos Toolkit has a Prometheus driver to export metrics and events from the experiments. It also has an Open Tracing driver as well as a Humio one. However, the tool does not yet provide a standardised report of the experiment results, which means that the way to observe the flow of the experiment is by checking the logs of Chaos Toolkit itself.
Verdict
Chaos Toolkit is an open, extensible, lightweight, and well-defined chaos implementation. It relies heavily on using drivers that provide the ability to create a custom chaos tool following a structured experiment definition.
There are two things to keep in mind here. Firstly, Chaos Toolkit is not ideal as a Kubernetes native, out-of-the-box chaos tool that does everything end to end, especially when it comes to defining different experiments. It is meant to be used as a skeleton or an API to build your own chaos engineering tools. Secondly, the burden of thorough reporting and observation falls on the users to adjust it to their own needs and infrastructure.
Pumba
Pumba is a chaos-testing, command-line tool focused on Docker containers specifically. Pumba does not really cover the concepts of tests or experiments, at least not as procedures that can succeed or fail based on how target applications respond. Instead, it works specifically as a chaos injector, wrapping several Linux utilities to change the behaviour of resources used by containers, such as network and CPU usage.
With an intuitive and sensible set of parameters, Pumba is easy to use in the command line and does a good job hiding Linux commands from the user. Considering the case of a host running several containerised applications, to find the expected containers to apply chaos—as opposed to changing behavior of the host itself—Pumba leverages the underlying API exposed by the Docker daemon running on the host machine to find containers by name, ID, or labels if running on Kubernetes.

The user can choose from a variety of experiments around the lifecycle management of containers (stop, kill, pause, or remove a container), network manipulation between containers using Network Emulation (netem), which is an enhancement of Traffic Control (tc), and stressing the CPU of the target using stress-ng.
Installation and management
The Pumba command-line tool can be used either by installing its binary for the respective OS or directly as a Docker image. In a Kubernetes cluster set-up, a pod carrying the Pumba CLI tool can be deployed as a DaemonSet. Making a Pumba pod present in all the nodes will allow target applications to be found without prior knowledge about which node they are running. (Note that you will have to delete the DaemonSet at the end of the experiment run.)
Being essentially CLI wrappers, Pumba pods deployed and running in the cluster are supposed to be ephemeral and alive only during the execution of the underlying command. Once the experiment completes or there is a manual action to stop it (for example, by deleting the Pumba pods), then chaos injection is reverted. For example, delays in the network are enabled and disabled like an on/off switch, where one tc command turns it on, another one brings things back to normal.
Currently there is no option to deploy Pumba as a Kubernetes operator, which would be a way to manage experiments in a more controlled manner. The current deployment approach makes it harder to manage in a multi-tenant environment, but multiple experiments can still be deployed simultaneously with different containers in the same DaemonSet.
Experiment definition and variety
Besides this specific set of experiments mentioned above, it is not possible to add new ones without modifying the source code of Pumba. The experiments to kill, stop, remove, or pause containers are simple to use. Where things become interesting is in the network experiments via the use of netem commands. There, the user has a plethora of options to create a tailor-made netem command, which can introduce delay, packet loss, rate limiting, and other types of network disturbances.
As an important sidenote, Pumba will target a specific interface completely (for example, eth0) and will not be able to attack specific ports or IPs of that interface.
The following manifest shows how a Pumba experiment can be executed by deploying Pumba as a DaemonSet:
|
In this experiment, Pumba will use netem to induce latency to the network interface of the target application. The way it achieves this is by using the target’s network namespace and adding delay to all of the IPs of that interface. Once the duration of the experiment is exceeded (in this case, after 20 seconds), the experiment is completed.
Security
It’s quite expected that the ability to affect network traffic or stress a CPU core using powerful Linux tools would require an unusual sort of privilege on the system. After all, these are the kind of privileges we want to keep away from business applications in the effort to make the surface of security threats as minimal as possible. With that said, specific Linux Capabilities, such as NET_ADMIN or SYS_ADMIN, may have to be assigned to the pod spec running Pumba to give it proper permissions to modify the appropriate settings.
Another important security aspect of Pumba is that it requires access to a file socket in the host node where the underlying Docker daemon exposes its HTTP API, usually the /var/run/docker.sock file. Additionally, it may be required to run as a privileged container. The reason is to query the container runtime—Docker, in this case—in order to find the right application containers, which Pumba will use as targets. This is important to consider as it involves node level privileges given to Pumba.
Observability
Apart from checking the logs, Pumba does not provide any other means of reporting the results of the experiment. It is merely an execution tool that performs certain tasks. Once they are complete, its job is done.
Verdict
The Pumba CLI is efficient and easy to use. It can act as the executor of certain experiments in a Kubernetes cluster, either from a DaemonSet point of view or just as a pod. The extensibility, management, and observability aspects are minimal, given the simplicity of the tool, which makes it less ideal for a complicated, multi-tenant environment without any other supporting tool. It’s definitely an interesting tool for individual one-off experiments, or to be used as part of a wider chaos platform.
Finally, while we mentioned some security concerns due to the fact that some powerful (and possibly dangerous) Linux tools are used under the hood, this is not specific to Pumba. Any chaos implementation using such methods will have similar considerations.
Litmus
Litmus is a complete chaos framework that focuses entirely on Kubernetes workloads. It consists of an operator written in Go that currently uses three main CRDs to execute an experiment:
- Chaosexperiment: The definition of the experiment with default parameters.
- Chaosengine: Binds the experiment definition with the chaos target workload. If successful, the experiment is initiated by the Litmus operator, overriding any variables specified in the manifest file.
- Chaosresult: Displays basic information about the progress and eventually the result of the experiment.
Once a chaosengine object is created, Litmus creates the Chaos runner pod in the target namespace. This runner will orchestrate the experiment in the specified namespace and against the specified targets.
Target identification is something that makes Litmus different. To zero in on the target, the user has to insert a specific annotation on the deployment (more workloads are supported here: DaemonSet, StatefulSet and DeploymentConfig). Then, the user needs to modify the labels and fields in the chaosengine object (an example is shown below) so that Litmus can then locate all (or some) of the pods of the target deployment.
Once the Operator verifies that all the above prerequisites are met (correct labelling, annotation, Chaosexperiment object, permissions), it will create a pod of the experiment runner, which is responsible for the execution of the experiment. This workflow allows for limiting the blast radius of an experiment, as well as for concurrent experiment executions.
Installation and management
The Litmus operator is a lightweight and stateless Go application that can be deployed as a simple deployment object in a Kubernetes cluster. Here, Litmus provides two options in terms of orchestrating the experiment. The default mode is restricting the experiment on a particular namespace, which is the process described above. In this case, the cluster administrators need to be mindful of resource utilisation, as the correct execution of the experiments depend on the individual namespace available resources.
Litmus also supports an Admin mode, where the chaos runner and experiment runner are both created alongside the operator in the same namespace. From there, the experiment runner will locate the target namespace and application to perform the experiment. This time the focus is on centralising the created chaos resources.
However, Litmus has some limitations mainly around observability, as in the case of multiple concurrent executions, it is hard to have a clear picture of all the experiments and around cluster permissions as in this case Litmus requires not only control of the workload resources of the related API groups but also the node resources since it needs more elevated cluster privileges.
In terms of management, Litmus is easy to use. However, it requires a bit more work when it comes to finalising an experiment. This involves manually removing labels, annotations, and deleting CRs, which should eventually be automated by the user. There is an ongoing effort to create Argo workflows to add this extra management layer on orchestrating different experiments end-to-end.
Experiment definition and variety
The interesting part about Litmus is that it provides a well-defined way to choose your own experiment runner. It uses the concept of chaos libraries that define the packages to be used for the execution of the experiment. For example, an experiment can use the Litmus native library to kill a pod, and another experiment can use the Pumba library to perform a network experiment.
This makes Litmus a very extensible and tool-agnostic framework, instead of just another chaos injection tool. Similarly, depending on the chosen runner, you can define your own experiment.

Internally, Litmus is using an Ansible runner at the moment to define and execute the experiment depending on the chosen chaos library. However, there is active development to create a more lightweight and simple Go runner, which the community seems to agree is the way forward.
There is a big variety of experiments supported by Litmus at the moment. They either use Litmus native or external tool libraries, and can be found here.
An example of the Chaosengine definition that will initiate and start an experiment is shown below:
|
In this custom resource, we instruct Litmus to execute the pod-delete experiment with certain parameters. Litmus will try to zero in on the target by using the .spec.appinfo and will already assume that the user has applied the right annotation and labels, as explained in the introduction of Litmus. These fields specify the namespace, label, and object kind of the target and can become optional if the .spec.annotationCheck field is set to false.
The engineState can be patched over to stop, which will cause the experiment to stop abruptly. This is an important feature that can help with taking action in cases when chaos spreads in the wider system.
Finally, we can configure the experiment using the environment variables, which will override the default values of the experiment definition.
Internally, once the Chaosengine object is validated and created, Litmus will create a regular Kubernetes Job with all the required parameters which will execute the experiment against the target.
Security
In terms of security, Litmus requires a well-defined set of cluster role permissions. Additionally, a prerequisite for every experiment is for the experiment-specific service account, role, and role binding objects to exist in the target namespace. Furthermore, as explained above, Litmus provides a thorough way of identifying the target workloads, starting from the higher-level object and finishing on the pod level. This serves well in limiting the blast radius and ensuring that chaos is injected only on the intended workloads.
Another interesting point is the required privileges of the executor pod. In case of network experiments (for example, using the Pumba chaos library), we would need the same privileges as mentioned above in Pumba, which is mounting to the docker socket or adding the proper capabilities in the security context. As we can see, Litmus is a multi-faceted framework with different layers that all need the appropriate attention from a security standpoint.
Observability
The reporting side of Litmus is driven mainly by the chaosresult Custom Resource. This is a customisable object that can be enhanced with more details about the experiment. However, at the moment it provides very simple information, mainly around the status of the experiment by displaying important events and eventually its result.
Verdict
Litmus seems a very promising chaos engineering framework that focuses on extensibility and orchestration in creating chaos in Kubernetes Native workloads. It has a vibrant and supportive community behind it and recently, it was admitted to the Cloud Native Computing Foundation as a sandbox project.
It can certainly be improved in terms of better reporting. However, it provides the framework for expanding it. It can work easily with any other tool and its main goal is to act as the chaos orchestrator, rather than the executor itself (although it can also do that very efficiently). It is well suited for large, complicated systems that require a higher degree of control and a growing variety of experiments to execute.
Chaos Mesh
Chaos Mesh is a chaos platform made exclusively for Kubernetes applications. It was created by PingCap to test the resilience of their distributed database TiDB, and it is very easy to use for other types of applications running in Kubernetes.
As a typical operator, a controller manager pod runs in a regular deployment and is responsible to watch for its own CRDs (NetworkChaos, IoChaos, StressChaos, PodChaos, KernelChaos and TimeChaos), which users can use to create new objects to specify and start chaos experiments.
To activate the requested actions against applications, the controller may have to contact the daemon service of Chaos Mesh deployed as a DaemonSet, so they can, for instance, manipulate the network stack locally to affect target pods running on the same physical node. For the I/O type of chaos, like the simulation of failures or delays in reads and writes on file systems, the application pods needs to share its volume mounts with a sidecar container that will intercept file-system calls. Sidecars are injected during app deployments with support of an Admission Webhook.

Chaos Mesh is a good middle-ground framework that is supposed to be used alone—not like an orchestrator connecting different tools and extensions—while also having a broad variety of experiments that can be used out-of-the-box.
Installation and management
As a Kubernetes operator, the installation is very easy and can be done by applying a set of manifests and CRDs to a cluster. A Helm chart is also available in the project repository, making it easy to install using Helm. In terms of management, it can be fairly straightforward when the Helm charts are used, since they are driven by the community. On the other hand, the injection of sidecar containers, and the required use of a daemonSet, make Chaos Mesh a bit harder to operate, as it can be considered quite intrusive to the cluster.
Experiment definition and variety
The list of chaos types are grouped in the following categories: network, pod, I/O, time, kernel and stress, each one with its own CRD type. They all share a common selector entry as a way to find target pods, besides the optional duration or recurrent scheduling of the desired chaos. Some of them, like NetworkChaos, have more options, like delay, corruption, or partition.
An example of a network chaos definition:
|
It’s generally easy to follow the examples to create a yaml file for your use case. A notable exception is the type of chaos involving disk IO. In order to correctly configure sidecars in applications pods, some extra configuration should be done beforehand with ConfigMaps to define what the sidecar containers will do by the time they get injected during the deployment of user applications.
Security
Chaos Mesh also uses some Linux utilities to implement the low-level chaos types. Similarly, it needs to use the Docker API in the host machine. Therefore, the daemon Pods (deployed as DaemonSet) will run as privileged containers, and will mount the /var/run/docker.sock socket file. The controller manager Pod will require permissions to manage MutatingWebhookConfiguration, besides some other expected role-based access control (RBAC) permissions, if the sidecar injection is enabled.
Observability
The main project repository mentions a chaos dashboard side project, but it seems it works exclusively for tests with their database product. Building a more generic dashboard project is on the roadmap. So far, the state of chaos experiments can be monitored by inspecting the Custom Resources objects in the cluster.
Verdict
Differently from the other high level tools in this list, Chaos Mesh does not have a strict concept of an experiment and it’s not an orchestrator with different implementation options. In this sense, it works similarly to Pumba as a simple chaos injector. Being available as a Kubernetes operator, with a range of chaos options based on CRD types, it’s certainly a tool that’s easy to install and use. While documentation could be better, the list of chaos types and configuration options is quite impressive without the need for additional tools.
Other Chaos Tools
These four chaos-engineering tools are not the only ones out there. The open-source community is always creating something new and contributing consistently to existing projects.
Tools like Chaos Blade (which is almost identical to Chaos Mesh), Kube Monkey, PowerfulSeal, KubeInvaders, Muxy and Toxiproxy are also quite popular and have their own strengths and weaknesses. Apart from the open-source realm, there are also several products that contribute to chaos engineering, with the most prominent being Gremlin, which is a complete chaos engineering commercial platform.
In addition, several community events are also getting traction nowadays, such as the Failover conference that gave many interestings insights into the world of site resiliency and chaos engineering.
Takeaways
Experimenting with all the aforementioned tools showed us certainly that Kubernetes Native chaos engineering is here to stay. The ability to execute experiments that represent real life events in a controlled manner in production systems seems scary at a first glance but it can certainly increase the quality not only of the business applications but of the infrastructure systems as well.
We identified two main categories of chaos-engineering tools: Chaos orchestrators Litmus and Chaos Toolkit being the prominent ones, and chaos injectors Pumba and Chaos Mesh. The chaos orchestrators aim to provide well-defined experiments using proper chaos engineering principles. Litmus is a more complete framework that still provides extensibility, while Chaos Toolkit aims to become the standard API to define experiments.
The chaos injectors focus on the execution of experiments. Pumba concentrates on Docker containers while providing the ability to create different experiments, and Chaos Mesh streamlines the execution of experiments in Kubernetes out-of-the-box.
The bottom line is, wherever you are in your Cloud Native journey, chaos engineering can increase the resiliency of your production systems and uncover hidden issues that typically occur only during real-life events. Depending if you need an executor or an orchestrator, there are a lot of open-source options available, all with their own advantages and disadvantages. What is more important is to create chaos experiments simulating real events in a well-defined, secure, and observable way.
Andreas Krivas is a lead Cloud Native engineer, and Rafael Portela a Cloud Native engineer, at Container Solutions. Christiaan Vermeulen, a Cloud Native consultant at the company, contributed to this article.
You can find all of our information about SRE and CRE in one place. Click here.

| ← Previous | Next → |
 |
 |